
Actually, it’s not the network!

My job mostly consists of troubleshooting issues (performance, errors…) where it is not known whether the root cause lies with the application or the infrastructure. Many times, I hear “it’s the network’s fault”. Why is the network automatically blamed for no apparent reason? I will give you my answers and also try to change your vision of how to troubleshoot.
The network can be the root cause of an issue. It can also generate a massively impacting problem. When you have a network loop inside a datacenter which crashes many applications, you don’t spend too much time to understand that’s the network’s fault. I spoke with people from other companies that do the same kind of jobs and they told me they hear the same thing "It's still the network's fault".
I have several hypotheses that can explain this situation:
- The first one is due to the application logs.
- The second one is due to a lack of knowledge on the network architecture and protocols.
- The third one is the performance issue linked to the network.
- The last one, may be the most important, is the way people troubleshoot the issues.
1- Applications logs:
When an error occurs, one of the first thing to check is its application logs. When a peer (client or application server) can not contact the other peer (application or DB server) you will see an error message:
“Unable to connect”, “Connection failed”, “Connection refused”, “Connection timeout”, “Check your connection”, “Destination unreachable”, … and sometime preceded by “Network error: XXX”
An application does not respond because the application service can be down, or the server itself, or the server infrastructure (hypervisor, storage). In fact, there are many more possibilities that the issue is not on a network. But the word “connection” refers to a vocabulary used in the network world. You can be under this influence. Keep in mind this is a generic error message.
Sometimes, you can see explicit logs like “net_error: connection failed”. It looks like a mistake of the developers which coded this message. A client, alone, can not determine if the issue comes from the network, the server or the application. But when the IT support will see the error message containing the “root cause”, they will immediately blame the network teams saying: “it’s the network, we have the proof on our logs.” The categorization of the application's logs is very important.
2- Architecture & protocols knowledge:
The second hypothesis can be linked to a lack of knowledge in the architecture or the network protocols.
Network architecture:
The first option is linked to the architecture and the devices. Devops engineers know very well their applications. They also have access to the system and they can determine the health of the backend infrastructure but, the network may look like a blackbox. Sometime the architecture is not shared/understood but also devops engineers haven’t access to the network devices. They don’t know how it’s configured, the security functionalities deployed, all the subtleties… I think for some people, when they are facing an issue without a clear root cause it’s easier to blame what you don’t know.
My advice is, if you haven't a good overview of your network architecture, contact the network team. It's very important to know how it has been designed to understand its physical limits.
Network protocols:
The second option is a lack of knowledge about the network concepts and how the network protocols work. How it works. For some people, when I open a network capture on Wireshark the reaction can be:“WOW…”. It looks like “Ok, I have no idea of what it is” or “I already saw that, but I don’t understand it”. This is normal, we cannot be an expert of everything. I know very good DBA or application SME, that’s assumed their lack of knowledge in network. This reaction is much preferable then the second one which is “I’m an expert” but in fact their knowledge is near of the first one. And you can hear, funny sentences for a network specialist like:
- “I did a ping on the port, it’s blocked.”: The ping command on OS are natively using ICMP, which is a layer 3 protocol. The ports are managed by layer 4 protocols, so they try to do something which doesn’t exist.
- “It’s the network because I did a traceroute to the server and it failed.”: Traceroute (ICMP on Windows, UDP random port on Linux) plays with TTL to determine the network path, but it can fail if there are firewall depending on the security policy in place (refer to what I mentioned earlier).
- “I saw a packet loss (on a TCP session), that generate data lost at the end”: TCP manages the retransmission/out of order to avoid data lost or corruption, it’s its job and this is invisible for the application.
- My favorite: “We have an issue because we saw a TCP RESET on the network capture”. It’s not specific to Michelin IT, I heard from our partner, customer, provider, editor etc…
I will try to put an end to this TCP RESET myth. When a TCP session is established, there are two ways to close the connection : Send a FIN packet (standard) or RESET packet (brutal). RESET was originally used to abort connection in specific cases. For example, if a server doesn't listen on a port that a client try to reach, or also if an application issue occurs which forces the session to end immediately. But sometime, RESET is just used to finish a TCP session quicker. It's why a RESET must be analyzed in the full TCP session.
My advise is to learn the network basics, you need to spend time, because network is not a simple part of the IT that you can understand in 2 min. But the Internet is full of videos about network created by companies like F5, PaloAlto, Cisco.... I can also suggest to you a youtuber who explains very well this topic : https://www.youtube.com/c/ChrisGreer
Of course, you can follow network certification like the well known CCNA from Cisco if you don't want to forget any network basics.
3- Network and performance issues:
The third scenario is the application performance variations based on geographic localisation.
Sometime, an application encountered performance issues compared when it has been tested in a POC or in the dev environment. All seems the same (OS version, CPU/memory configuration, application data…) except the network architecture. So, people say: “It worked very well in this environment, in the other not, it’s the network?”. Most of the time the pain point is the latency.
It's not because we have a huge latency inside our datacenter, it’s because the latency effect hasn’t been taken into consideration. I faced this issue with application developed by Michelin or external editors.
If the application has been developed with application and DB servers in the same physical device, when it is installed in the datacenter environment where application and DB servers are physically separated it can generate a huge impact. Take an example with a user action does 200K sequential read/write with the DB. If we compare a latency of 50µs inside the same physical server and 200µs that there is between two servers, you increase by 4 the response time. The latency impact goes from 20s to 80s.
I take this opportunity to repeat here that latency it’s one way. I remember an editor that know its application has been not, let’s say, well designed for datacenter environment told us: “The prerequisite for our application is a latency under 300µs”. We said it’s fine for us. When we deployed it, it was very slow, and after analyzing he said: “Your latency is too high you have around 500µs (it’s your fault)”. In fact, he just did a mistake between the latency and the round-trip time.
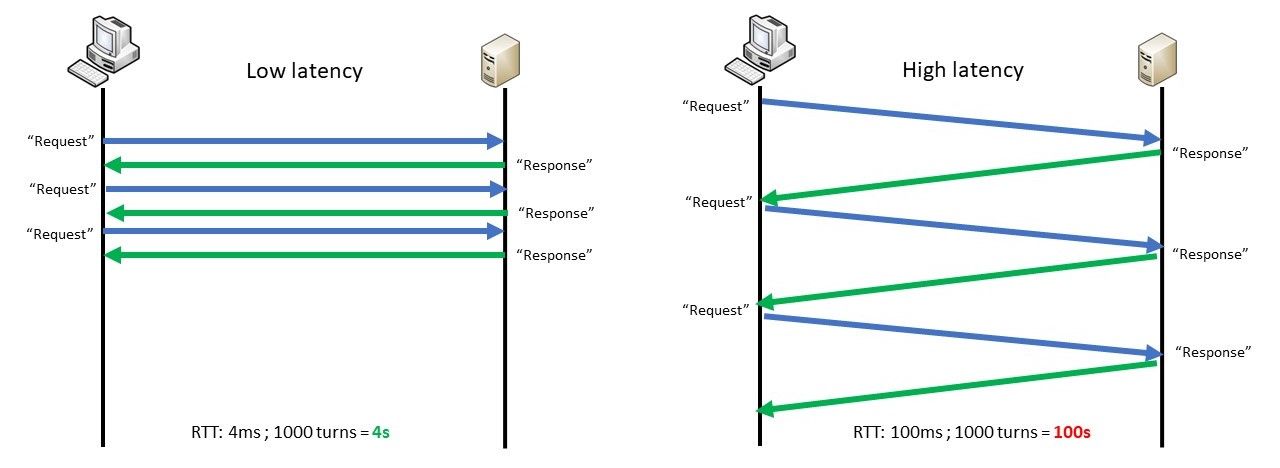
The other common issue is the throughput limitation. A devops engineer (on the headquarter) tested to download a file on its application, it was very fast but when a client on a remote site tried, it was very slow. So, he deducted automatically that there is a network issue on the remote site. In fact, it was also linked to the latency impact:
The client sends X packets then wait for an application acknowledgment (like OK I received the first block you can send the second). It's fine for huge packages download (ex: OS update), if the application divided in block (ex: 100MB) it can allow a client to download block by block and avoid to lose everything if the client lost the session. But when the blocks are small (ex: 1MB) it will generate a lot of application's acknowledgment. Example: 1GB divided in 1MB application blocks with a RTT 4ms vs 100ms => Application coding impacts is 4s in one case vs 100s in the other.
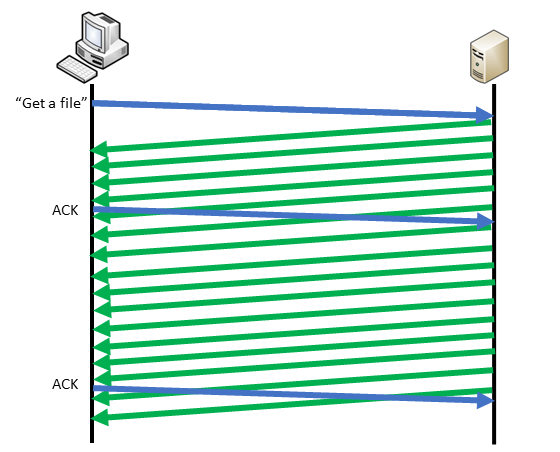
TCP already manages the integrity of the data. If you want the best performances, the application must not interact inside the data transfers. You will have something like that:
A simple test that I do is to simulate the latency of the remote site on the devops engineer's laptop (with clumsy for example). Automatically the performance is drastically impacted and looks like the client on the remote site. That’s easy to understand that it’s not linked to the network’s remote site. Almost (if it’s not always) the next step is:
Q:“How can we reduce the latency because it impacts our application?”.
R: “Nothing.” (To be honest Michelin we have very good value linked to the distance compared to the reference on Internet. Optical fibers used are the same).
It’s not the right way of looking the issue, a DBA gave me a good image of the situation: “It's as if you want to transport a large pile of sand with a teaspoon at a distance of 100m”. The problem is not the distance it’s the teaspoon.
My advice is:
- Test your application with a poor latency during the testing phases. It will tell you if the application is sensitive or not to latency.
- Let TCP manages the data transfers.
NOTE: A point regarding the network saturation. In case of huge exchanges between two peers, TCP tries to consume the maximum available bandwidth and it’s not a problem. In case of concurrence, it adapts its throughput to be fair with the others traffics. So a network link saturation is not a problem, it becomes one when several hosts need the full bandwidth and they cannot. At this point that generates slowness, sometimes acceptable, sometimes not. It depends on the QoS level set for the flows (A traffic can crush another one). If an application was underestimated by the project team, it has good chances to be tagged with a normal QoS priority and impacts others applications which share the same level. A good estimation is crucial to make the right architecture decision.
4- How troubleshoot:
I will give you in this last part an idea of how I proceed when I troubleshoot. It is based on my experiences and it's not an absolute truth.
The first thing : It is very important to have the big picture of the problem to determine where the root cause can be localized. When I’m solicitated to solve an issue, I still begin with questions such as:
“How many applications are impacted?”
“How many Michelin sites are concerned (Worldwide or a specific zone)?”
“How many users are impacted?” …
The more the impacts are global, the more the infrastructure can be the root cause and the incident response will be adapted to each situation. It's why an infrastructure knowledge is essential.
But if the answers look like there is just a specific application impacted, I will ask:
“When the issue occurs?”
“Is there a degradation or it arrives suddenly? “
“Is the problem still here?”
If it’s not persistent: “Is it random or reproductible”
“Did you do something on the application that can be linked?”
“Is there higher periodic activities on your application, like end of month, seasonality?”
“Did you check the application logs?”
If it’s an vendor product, “Did you contact the vendor to get a support?”...
"Can you give me the application architecture?"
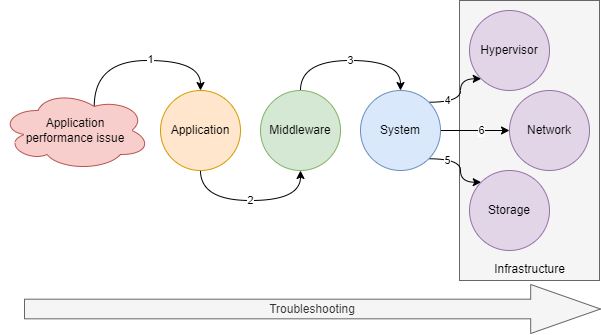
After that if the answers don’t point to an application issue, then I look on the server the CPU utilization. These metrics are very good to determine, in certain cases, if the issue is on the application or OS/infrastructure side. For example, in Linux, we can easily see the CPU user (linked to application process), wait (network or most of the time disk issue) and system (for example can be linked to the swap) part. Then if it’s linked to an application process, I check which one, and if I see a deviation or a behavior’s modification on the application side, I focus on that part and try to understand why there are more application activities. (PS: A common misunderstanding, if you see a process at 90%, or +100% it’s not a problem, you need to correlate this % to the number of CPU cores. A process, on a server with 4 cores, can go up to 400%). Then I check the load average and the process status. If nothing relevant, I look the memory part, to analyze if there is swapping activities for example, then I go to the disk activities (number of IO, bytes read/write, latency), then to the network part (TCP sockets status, error counters, packet/s and bit/s).
Depending on the issue (example: a crash), sometimes I go automatically to the system logs.
If there is nothing relevant, I will check on the hypervisor side, CPU & memory (especially the CPU ready & memory ballooning stats), disk activities (IO, latency…), network activities (traffic and error counters), vMotion activities…
If nothing relevant on that part, I can check the network (it depends on the application architectures and flows paths). To analyze the network parts I will use several tools: One is the monitoring of each device (CPU, memory, interfaces…) that is very useful to know the health of the network infrastructure. The second kind of tools are the network probes which are very important to capture the traffic and analyzing what’s go through the network. Thanks to the network probes' data rentention, we have the possibilities to troubleshoot something which happened in the past. Sometimes we can spend more time to reproduce a problem rather than analyze it. The last one is latency monitoring. We are doing it with simple ping, but it provides two essential information: latency deviation and packet loss. With that it’s easy to detect bottlenecks inside the network infrastructure. Thanks to simple pings we can detect sporadic network loop, BGP flapping, network device saturations, path modification, WAN links issues… but also inside Azure cloud where we can’t see the infrastructure. As you can see the network part is present but arrive almost at the end, not at the beginning.
My advice is still analyzing from the top to the bottom, from the more specific (application) to the less specific (infrastructure).
Then if I see nothing, I need to deep dive. One of my favorite things is to run an impacted application scenario, do a network capture in same time and determine where the response time is localized: on client, on the network or on the server side (application or DB servers). Of course, the mandatory condition is the reproducibility of the problems in order to analyze them.
Conclusion
I will conclude my article with an analysis' result that I obtained few years ago. I analyzed all tickets that my team resolved and I sorted them by the root cause. The result was: around 65% due to the application and around 35% due to the infrastructure. The network represented between 15-20% of the total of the issue.
My final advice is: The next time you are facing an issue, don’t think first it’s the network else you may say at the end “Actually, it’s not the network!”