Implementing SLI/SLO on End-to-End Critical User Journeys

Avoiding the trap of Application-centric SLI to capture actual user satisfaction
Introduction
In today’s digital world, ensuring a seamless user experience is paramount. Organizations striving to deliver reliable services often grapple with the challenge of finding the right balance between introducing new features and improving reliability and performance. Enter Service Level Indicators (SLI) and their Service Level Objectives (SLO) — powerful tools that allow to factually measure user's satisfaction and help finding the right balance between innovation and stability.
The Critical User Journey
Before diving into SLI and SLO, let’s embark on a journey — one that begins with understanding how our users’ interact with our system. By identifying what are the most critical functionalities they use and what challenges they may face, we gain valuable insights. These insights form the bedrock for implementing SLI, providing us with factual data about our users satisfaction and allowing us to move beyond mere feelings.
It is important to note here that a critical user journey may span across several applications or services (sometimes managed by different teams), in our context we call this end-to-end chain a Business Process.
Operational Business Processes: A Closer Look
A simple definition of a business process in our context:
- It refers to a task carried out by a user with a specific objective in mind.
- Each task performed within this process has a starting point and an outcome.
- A simple example can be Printing a document.
[Start] The user initiates the printing process from an application.
[End] The user retrieves the printed document from the printer.
This is a simple example, however if we drill down into the technical implementation of this seemingly simple user interaction, complexity arises.
The Complexity Within
What's so difficult in that? In a typical reactive fashion, we will only start thinking about measuring the performance of our application when the users start complaining about their documents taking forever to print. Makes sense, right?
Doing this may allow us to identify that the issue is not within the application itself but with the network, the infrastructure, or the even within the printer driver and we might suggest the user to buy a new printer. What if the issue is actually with our application? Where is it exactly? Maybe the performance issue only affects printing, and overall, our application works just fine. So why worry about it!
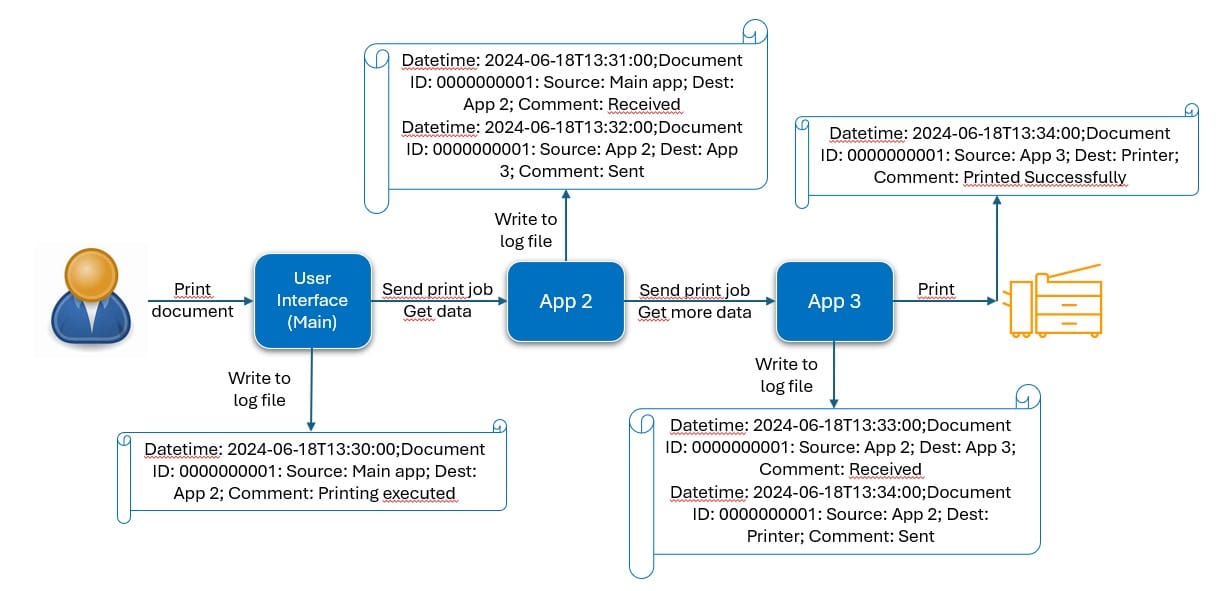
Imagine our application ecosystem—a web of interconnected services maintained by different teams. When a user triggers a print job from his application, this triggers off a chain reaction. Information flows from one application or middleware to the next, like a relay race, until finally the document to print is pushed to the printer.
Here is an exemple to illustrate:

User-Centric Prioritization
Why bother with SLI and SLO? Because user satisfaction matters. Beyond flashy features, users cherish reliability above all others. Picture a truck driver waiting to leave a warehouse, needing customs documents to be printed before he can leave promptly. Or an office worker racing against the clock to finish tasks before leaving for the weekend. For them, swift document printing isn’t a luxury—it’s essential.
Google’s Approach: Balancing Reliability and Features
Google’s adoption of SLI and SLO exemplifies this balance. By defining SLOs, they commit to specific reliability thresholds. This commitment ensures that introduction of new features don’t compromise system stability. It’s a win-win: Users get dependable services, and Google maintains its innovative edge.
In summary, SLI and SLO empower us to measure, optimize, and prioritize user satisfaction. So, let’s embrace this journey—one where facts replace feelings, and reliability meets features.
By defining a Service Level Objective (SLO), we create a balance between Reliability and Features.
Unlocking User Satisfaction: The Power of SLI and SLO
Implementing SLI/SLO on a business process
Referring back to our previous example, if we identify the printing of a document as both ubiquitous and critical, then, it is essential to measure it in order to accurately assess the performance. Enter Service Level Agreements (SLA), Service Level Indicators (SLI), and Service Level Objectives (SLO)—our compass for navigating the printing journey.
Setting the Scene: The Service Level Agreement (SLA)
Imagine a user standing by the printer, waiting for a document to materialize. How long should they wait? Defining an acceptable end time is crucial. Our SLA sets the stage: a critical document must print within 5 minutes. But this isn’t just an arbitrary number—it’s a balance between IT efficiency and business impact. In this blog we'll focus on successful prints with the SLI type being "Latency". Additionally, we can track unsuccessful prints and introduce another SLI named "Error Rate".
- In an IT context: The 5-minute timeframe should be based on the average printing duration during regular working hours.
- From a business standpoint: The 5-minute limit ensures that there are no negative impacts on People or Profit.
With IT and business reaching a consensus, we can set our SLA to print a critical document in under 5 minutes.
The Service Level Indicator (SLI): Measuring the Journey
Now that we have our SLA, let’s dive into the mechanics. The End-to-End Service Level Indicator (SLI) tracks the entire printing journey—from user click to physical output.
In an ideal world, we would implement such traceability with technologies like OpenTelemetry that allows each application to participate in a distributed tracing scenario. Unfortunately, in our context, we are often mixing legacy technologies with more recent ones, and we often need to implement correlations with standard logging facilities.
To calculate this, we need detailed logs from each application involved. Each logs should contained:
- A timestamp, which will enable us to identify the exact moment the user pressed the print button or when the request reaches the application or the printer successfully prints the document
- A unique identifier or Correlation ID, which will allow us to differentiate between individual documents.
- The source of the document.
- The destination of the document.
We expect the developers responsible for each application to incorporate these specific details into the application logs. The application situated in the middle of the process will have two entries in the log file. The first entry will indicate the time at which it received the request, while the second entry will denote the time at which the request was forwarded to another application or the printer. On the printer side, we can utilize the print spool logs to obtain the document ID and the printing time.

With the provided information, we can now proceed to perform the following calculations:
- The End-to-End time it took to print a document.
- The time between each application for debugging purposes.
Calculating the SLI: A 28-Day Quest
Now, it is necessary to establish a specific period for the calculations. According to Google's recommendation, it is advised to calculate the Service Level Indicator (SLI) over a period of 28 days. However, the appropriate duration for the calculation depends on the intended use of this information. It is important to note that the SLI should always be expressed as a percentage.
One specific calculation that can be performed is determining the percentage of documents printed in less than 5 minutes. To calculate the time between two applications, it is sufficient to subtract the time recorded in the logs for each application.
In order to calculate the SLI, we need to consider the following events:
- Good events: Documents printed in under 5 minutes.
- Valid events: Successfully printed documents.
To obtain the SLI in percentage, we divide the number of Good events by the number of Valid events and then multiply the result by 100.
Ultimately, the outcome of these calculations will provide us with a comprehensive understanding of the printing process.

Defining the SLO: A Symphony of Collaboration
Now that we have our SLI giving us factual figures about the users feeling in regards to printing a critical document, it is time to define our SLO.
It is crucial to establish the Service Level Objective in collaboration with the Build, Run, and Business teams.
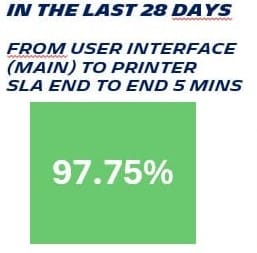
If our SLI is calculated at 97.75% and user satisfaction is low, it indicates that our SLO should be set higher. Conversely, if users are satisfied, we can set an SLO of 97% or lower. This implies that we are allowing room for errors, as perfection is unattainable and some errors may go unnoticed by users, as per Google's explanation. We are essentially quantifying the error rate and setting a mutually agreed upon target among all stakeholders - Build, Run, and Business - to ensure the delivery of the desired level of service quality.
In the event that we fall below our target, the next steps should be carefully considered.
Reliability vs Features
In the point of view of an end-user
Welcome to the realm of Service Level Objectives (SLOs)—where precision meets user satisfaction. Buckle up, because we’re about to dive deep into the art of balancing performance and features.
When SLOs Falter: A Clear Path
If our validated SLO is not met, then the solution becomes clear.
- The user's dissatisfaction with our service necessitates a halt in deploying new features.
- Instead, our focus should shift towards enhancing the system's performance.
Although there is always room for improvement, time constraints imposed by business objectives prevent us from dedicating the necessary time. However, this approach enables us to prioritize customer centricity and develop in alignment with our end-users' experience.
Error Budget Consumption: The Burn Rate Graph
If we are above our validated SLO, we can confidently take calculated risks and accelerate our delivery speed as long as we maintain our validated SLO. But how can we accurately determine on a daily basis whether we are meeting or falling short of our SLO?
We need to calculate our error budget consumption
- So, let's make it a fraction. If we are below 1, we are good and above 1, we have breached our SLO. The formula will be:

- So if we plot it on a time line graph, we are going to see how fast we are consuming our error budget on a daily basis.

This graph will allow us to implement error budget policy on the operational business process "Printing a critical document in less than 5 mins"
The policy will be:
- If we are below, we can keep on delivering new features faster
- If we cross the red line and breached our SLO, then we need to halt any changes related to new features and work on changes related to improving the performance.
Behold! We have now acquired the ability to determine the satisfaction level of our esteemed users with our exceptional service. Moreover, we can effortlessly delve into the root cause of any problem that may arise, ensuring swift resolution and minimal impact on our Service Level Objective.
The burn rate is also an excellent indicator to alert on. When it goes up, you can safely assume that there is an actual degradation of the quality of the service as seen by the end user.
To go further, our application can serve several critical business processes. So, how can we have one burn rate graph combining all the critical business processes?
Watch out for the next blog!!! Please subcribe ----->


