
Embracing Kaizen time to develop Snowflake Grafana plugin with Go
The article outlines the development of a Snowflake Grafana plugin using Go. It discusses plugin architecture, development, testing, and deployment, demonstrating how it enhances visualization of Snowflake data in Grafana, driven by the Kaizen philosophy.


What is Kaizen ?
Kaizen, a Japanese term meaning "change for the better" is a philosophy that encourages continuous improvement in all aspects of life. In a business context, this can mean seeking out new methods to increase efficiency, productivity, and quality. Kaizen, therefore, is the time dedicated to identifying and implementing such improvements.
In the current IT world, it is crucial to continuously improve our tools and our knowledge. I used this time to enhance our existing monitoring solution to be able to visualize insights from Snowflake in our existing data visualization tool : Grafana.
How To Visualize Snowflake Data in Grafana ?
The best way to visualize data in Grafana is to create a connection with a datasource plugin.
There are two kinds of datasource plugin in Grafana:
- The first one was designed to execute integration query on the client-side (in the browser) but it has some limitations.
- The second one called a datasource plugin backend is a type of plugin that includes a server-side component, extending the functionality of Grafana beyond its traditional client-side capabilities.
To query Snowflake data I used the provided and supported Snowflake driver. I didn't choose to use the Snowflake Rest API due to important limitations. That is why I choose to develop a datasource plugin backend.
Architecture of a datasource backend plugin ?
By default this kind of plugin is composed of two parts:
- The frontend used to develop plugin UI written in React.
- The backend part written in Go.
Grafana provides off-the-shelf libraries in React to facilitate UI development with predefined components (like inputs, buttons, switches, ...) and a Go library with some utility classes to simplify data manipulation in the backend.
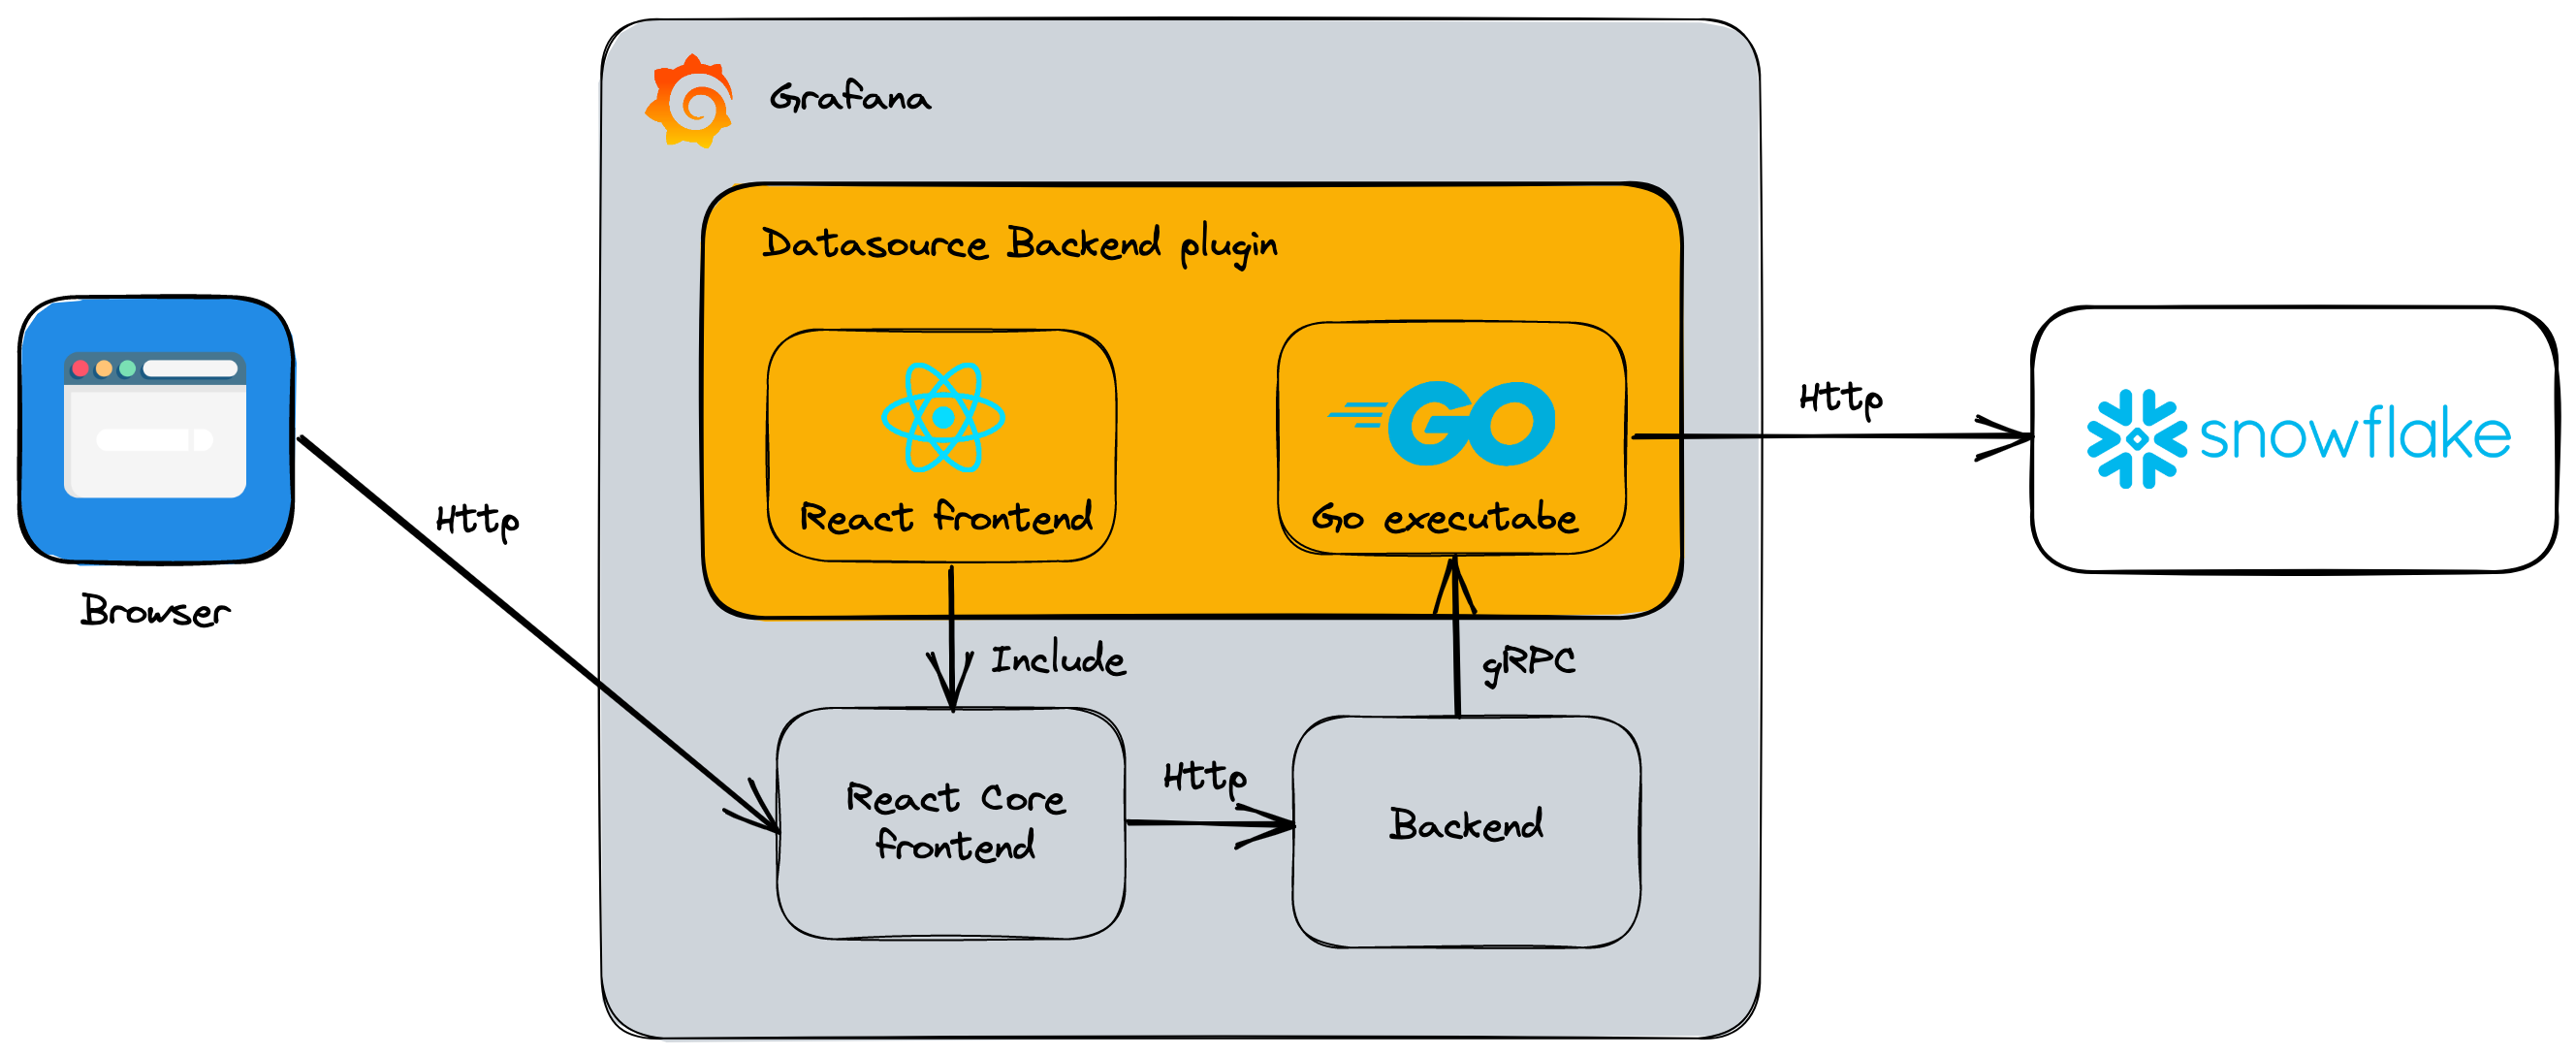
Grafana backend plugin are based on Hachicorp's go-plugin that is a plugin system over RPC.
This has multiple benefits:
- Stability: This plugin system starts a subprocess of the Grafana Server for every backend plugin. It's very useful to avoid host process crash due to a panic in a user plugin.
- Ease of development: Plugins can be written in any language that supports gRPC (languages supported).
- Security: The plugin is hosted on the same host (VM/container) as the Grafana service and communicates only with gRCP to it. It only has access to the interfaces and arguments given to them, not to the entire memory of the Grafana server.
The default language used by Grafana for backend plugins is Go, so I used the Snowflake Go driver to implement this Grafana integration with the datasource. This driver implements the Go database/sql package that provides a generic interface around SQL databases (PostgreSQL, MySQL, ...) to ease the development.
Capabilities of a plugin
Backend plugins can expose several key capabilities like:
- Query data
- Resources
- Health checks
- Collect metrics
- Streaming
The "Query data" capability is mandatory to be able to extract data from the Snowflake database and send it back to the Grafana server. The response sent via gRPC contains data frames, which are used to visualize the data in dedicated graphs on the Grafana web interface.
I chose to implement an optional feature, "Health checks". This allows a backend plugin to display the status of the plugin in the settings UI page when a user modifies it.
Natively, a plugin’s health check endpoint is exposed in the Grafana HTTP API and allows external systems to poll the plugin’s health.
And the other capabilities are not currently needed for this plugin.
Let’s develop our plugin
To start developing a backend plugin, Grafana provides a simple CLI to quickly scaffold, develop, and test plugins without worrying about configuration details.
It provides also a SDK with a number of useful utilities and abstractions for developing backend plugins.
Frontend
The frontend part is written in React and the UI is quite simple, by default a datasource plugin only needs an interface to configure the datasource at initialization.
First I needed to install Node.js and Yarn tools. These tools are used to work with javascript to manage dependencies, build and custom steps needed for development and continuous integration. Next, I used the command line interface provided by Grafana for plugin development. It simplifies a lot of tasks to bootstrap your plugin.
For that, I executed the node package create-plugin:
Once the project structure is initialized, we can start to develop the datasource configuration UI with React.
This UI is quite simple with 3 main sections:
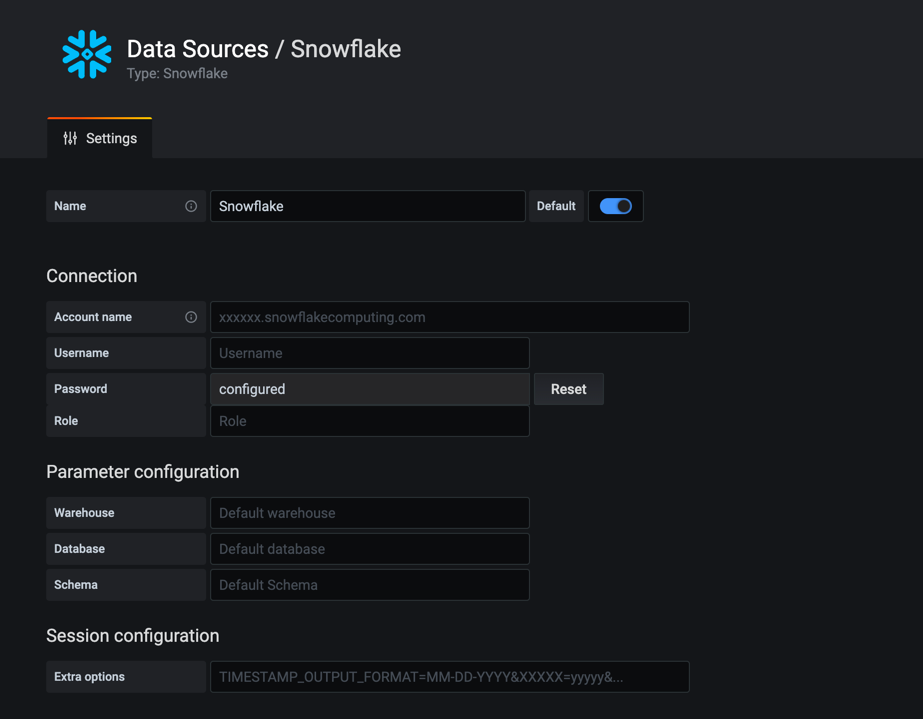
- The first one : "Connection" is related to the global Snowflake instance configuration like account name and credentials.
- After that, some "parameters", when we want to define default configuration for all queries
- And some extra configuration for fine tuning the database driver like the date format, timezone, ...
To develop the UI, we only need to take care of secrets like passwords. Secrets can be set or reset, but once configured it must not be sent back to the frontend.
In our plugin we have a secure password and non-secure configuration (Account name, username, ...).
In terms of code, two files need to be modified::
- src/types.ts holds custom types definitions.
- src/ConfigEditor.tsx holds the code for the Administration UI, showing and changing the configuration.
In Types.ts file, SnowflakeOptions is the interface definition of the non-secure configuration. And the interface for secured configuration are defined in SnowflakeSecureOptions.
import { DataQuery, DataSourceJsonData } from '@grafana/data';

/**
 * These are options configured for each Snowflake instance
 */
export interface SnowflakeOptions extends DataSourceJsonData {
  account?: string;
  username?: string;
  role?: string;
  warehouse?: string;
  database?: string;
  schema?: string;
  extraConfig?: string;
  basicAuth: boolean;
}

/**
 * Value that is used in the backend, but never sent to the frontend
 */
export interface SnowflakeSecureOptions {
  password?: string;
  privateKey?: string;
}
Backend
After setting up the frontend, it's time to start working on the backend.
The backend is written in Go, and to develop it, you should use two tools:
- Mage that allows you to write your build scripts in Go. Mage tasks are defined in a
magefile.goscript in your plugin's root directory - Delve is a debugger for the Go programming language. It provides a command-line interface and supports various features like setting breakpoints, stepping through code and more.
Understanding the structure of a Grafana backend plugin is crucial, including the unique lifecycle it follows, which incorporates various hooks for initialization, querying data, health checks, and more.
The central part of the Go plugin is the main.go file, which serves as entry point of the plugin where you register it with Grafana:
package main

import (
	"os"
	"github.com/grafana/grafana-plugin-sdk-go/backend/datasource"
	"github.com/grafana/grafana-plugin-sdk-go/backend/log"
)

func main() {
	// Start listening to requests send from Grafana. This call is blocking so
	// it wont finish until Grafana shutsdown the process or the plugin choose
	// to exit close down by itself
	err := datasource.Serve(newDatasource())

	// Log any error if we could start the plugin.
	if err != nil {
		log.DefaultLogger.Error(err.Error())
		os.Exit(1)
	}
}
Here, newDatasource() is a function that would return an instance of the Snowflake data source.
When you implement a datasource, you need to write several Go source files (like query.go and check_health.go). These files are associated with different features you want to add. For each feature, there is a specific function that you need to fill out with your own code.
Example of a query data function
func (td *SnowflakeDatasource) QueryData(ctx context.Context, req *backend.QueryDataRequest) (*backend.QueryDataResponse, error){}
Example with the health check capability
package main

import (
	"context"
	"database/sql"
	"fmt"

	"github.com/grafana/grafana-plugin-sdk-go/backend"
	_ "github.com/snowflakedb/gosnowflake"
)

// CheckHealth handles health checks sent from Grafana to the plugin.
// The main use case for these health checks is the test button on the
// datasource configuration page which allows users to verify that
// a datasource is working as expected.
func (td *SnowflakeDatasource) CheckHealth(ctx context.Context, req *backend.CheckHealthRequest) (*backend.CheckHealthResult, error) {

    // Create connection
	connectionString, result := createAndValidationConnectionString(req)
	if result != nil {
		return result, nil
	}
	db, err := sql.Open("snowflake", connectionString)
	if err != nil {
		return &backend.CheckHealthResult{
			Status:  backend.HealthStatusError,
			Message: fmt.Sprintf("Connection issue : %s", err),
		}, nil
	}
	defer db.Close()

    // Validate the connection
	row, err := db.QueryContext(ctx, "SELECT 1")
	if err != nil {
		return &backend.CheckHealthResult{
			Status:  backend.HealthStatusError,
			Message: fmt.Sprintf("Validation query error : %s", err),
		}, nil
	}

	defer row.Close()

    // Return status
	return &backend.CheckHealthResult{
		Status:  backend.HealthStatusOk,
		Message: "Data source is working",
	}, nil
}
How to test
I utilize the Testify toolkit to write unit tests on Go language applications. Testify, a popular toolkit, provides a host of common assertions and mock interfaces that seamlessly integrate with Go's standard testing library.
For an effective and systematic testing approach, I create a separate test file for each Go class that needs to be tested.
Furthermore, each function within these classes is tested through a corresponding dedicated test function. This methodology ensures comprehensive coverage and thorough testing of each code segment.
func TestGetConnectionString(t *testing.T) {

	config := pluginConfig{
		Account:     "account",
		Database:    "database",
		Role:        "role",
		Schema:      "schema",
		Username:    "username",
		Warehouse:   "warehouse",
		ExtraConfig: "conf=xxx",
	}

	t.Run("with User/pass", func(t *testing.T) {
		connectionString := getConnectionString(&config, "password", "")
		require.Equal(t, "username:password@account?database=database&role=role&schema=schema&warehouse=warehouse&conf=xxx", connectionString)
	})

	t.Run("with private key", func(t *testing.T) {
		connectionString := getConnectionString(&config, "", "privateKey")
		require.Equal(t, "username@account?authenticator=SNOWFLAKE_JWT&database=database&privateKey=privateKey&role=role&schema=schema&warehouse=warehouse&conf=xxx", connectionString)
	})

	...
}
Packaging and deployment
When it comes to Grafana plugin deployment, the advantages of using Go become more evident.
Go's approach to handling dependencies via statically linked binaries eases the dependency management. Binary produced contains all the necessary dependencies, which are linked at compile-time. This feature is particularly interesting in a cross-platform context, where the same code needs to run on multiple operating systems with different architectures.
With that, Go executable files are immune to versioning problems that often arise when different environments have different versions of the same dependencies installed. This leads to more robust deployments, as the behavior of the plugin will be consistent across all systems.
Conclusion
From a technological perspective, Go offers a clever blend of simplicity and performance. Its minimalist syntax promotes ease of learning and code maintenance for developers.
Our decision to publish this plugin on Github as an open-source project has opened up avenues for external contributions, enabling a continual improvement process.
 michelin
This plugin has been used for more than one year in production for visualizing technical information from Snowflake and has greatly simplified our end to end monitoring with only one tool.
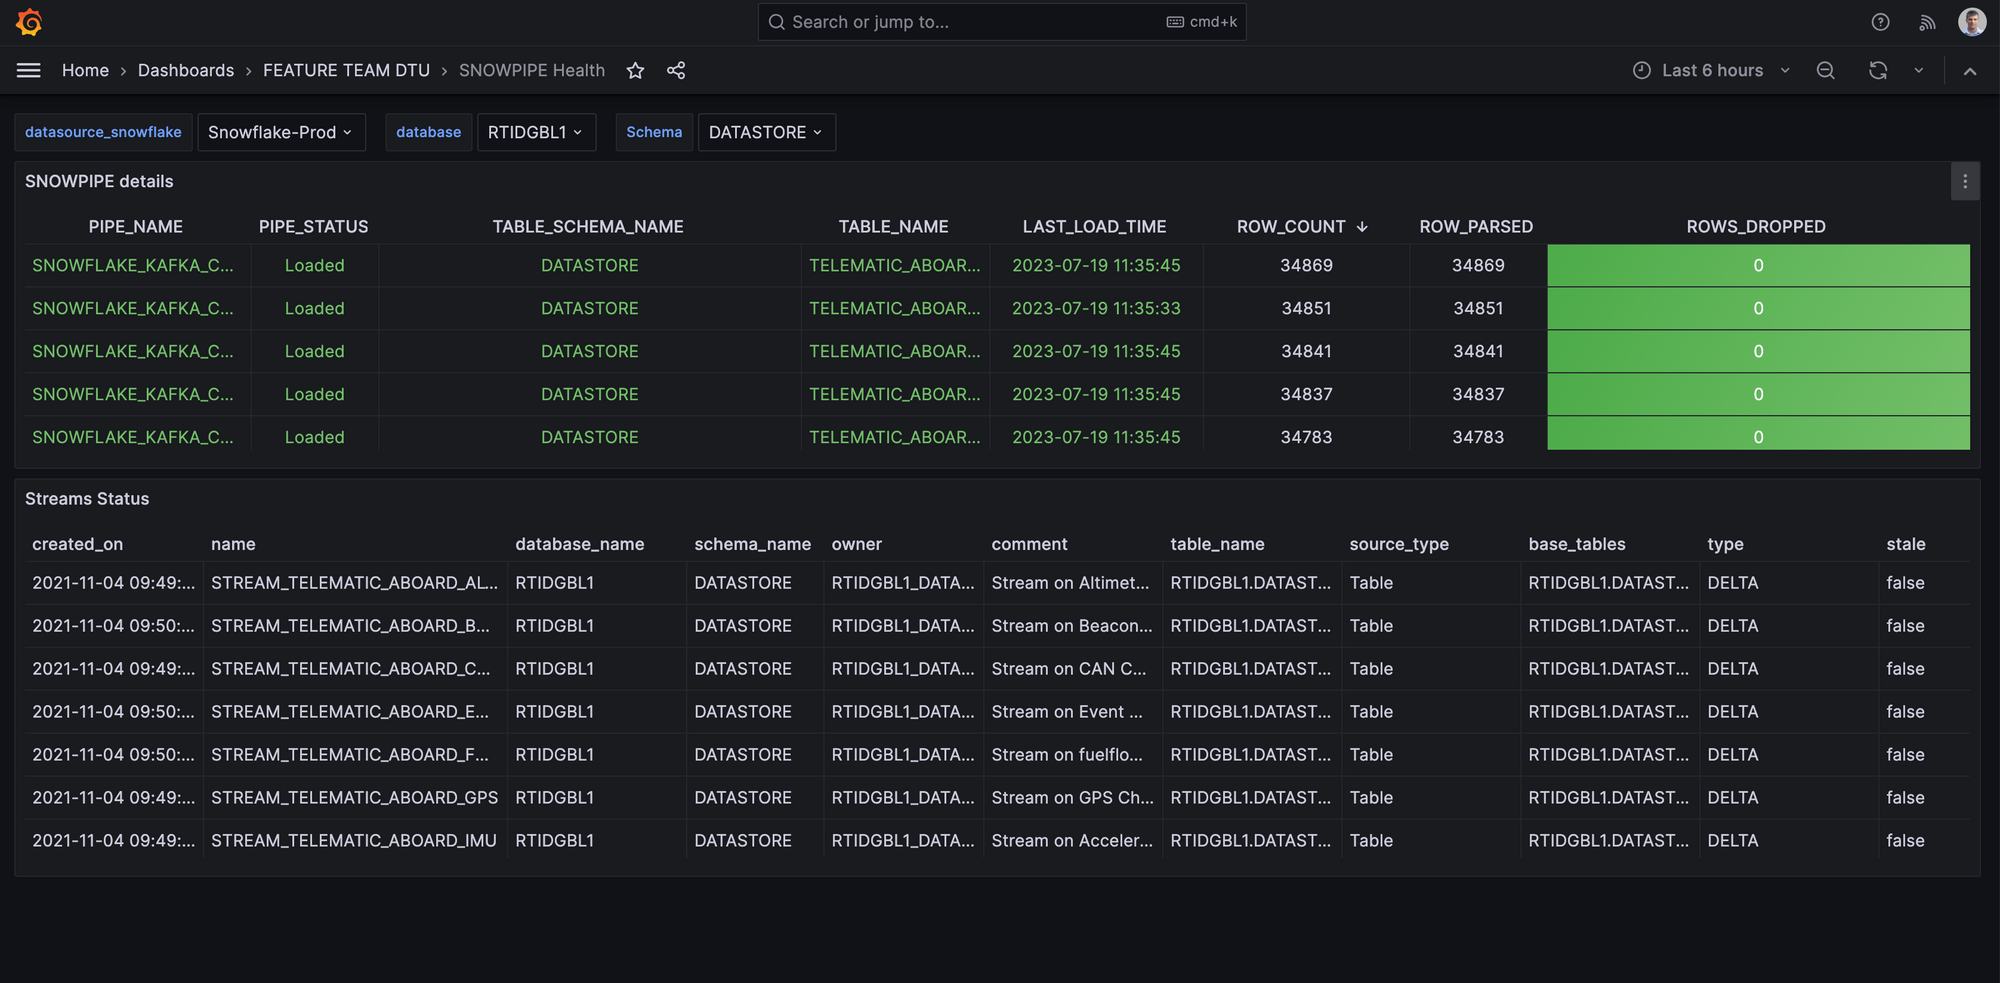
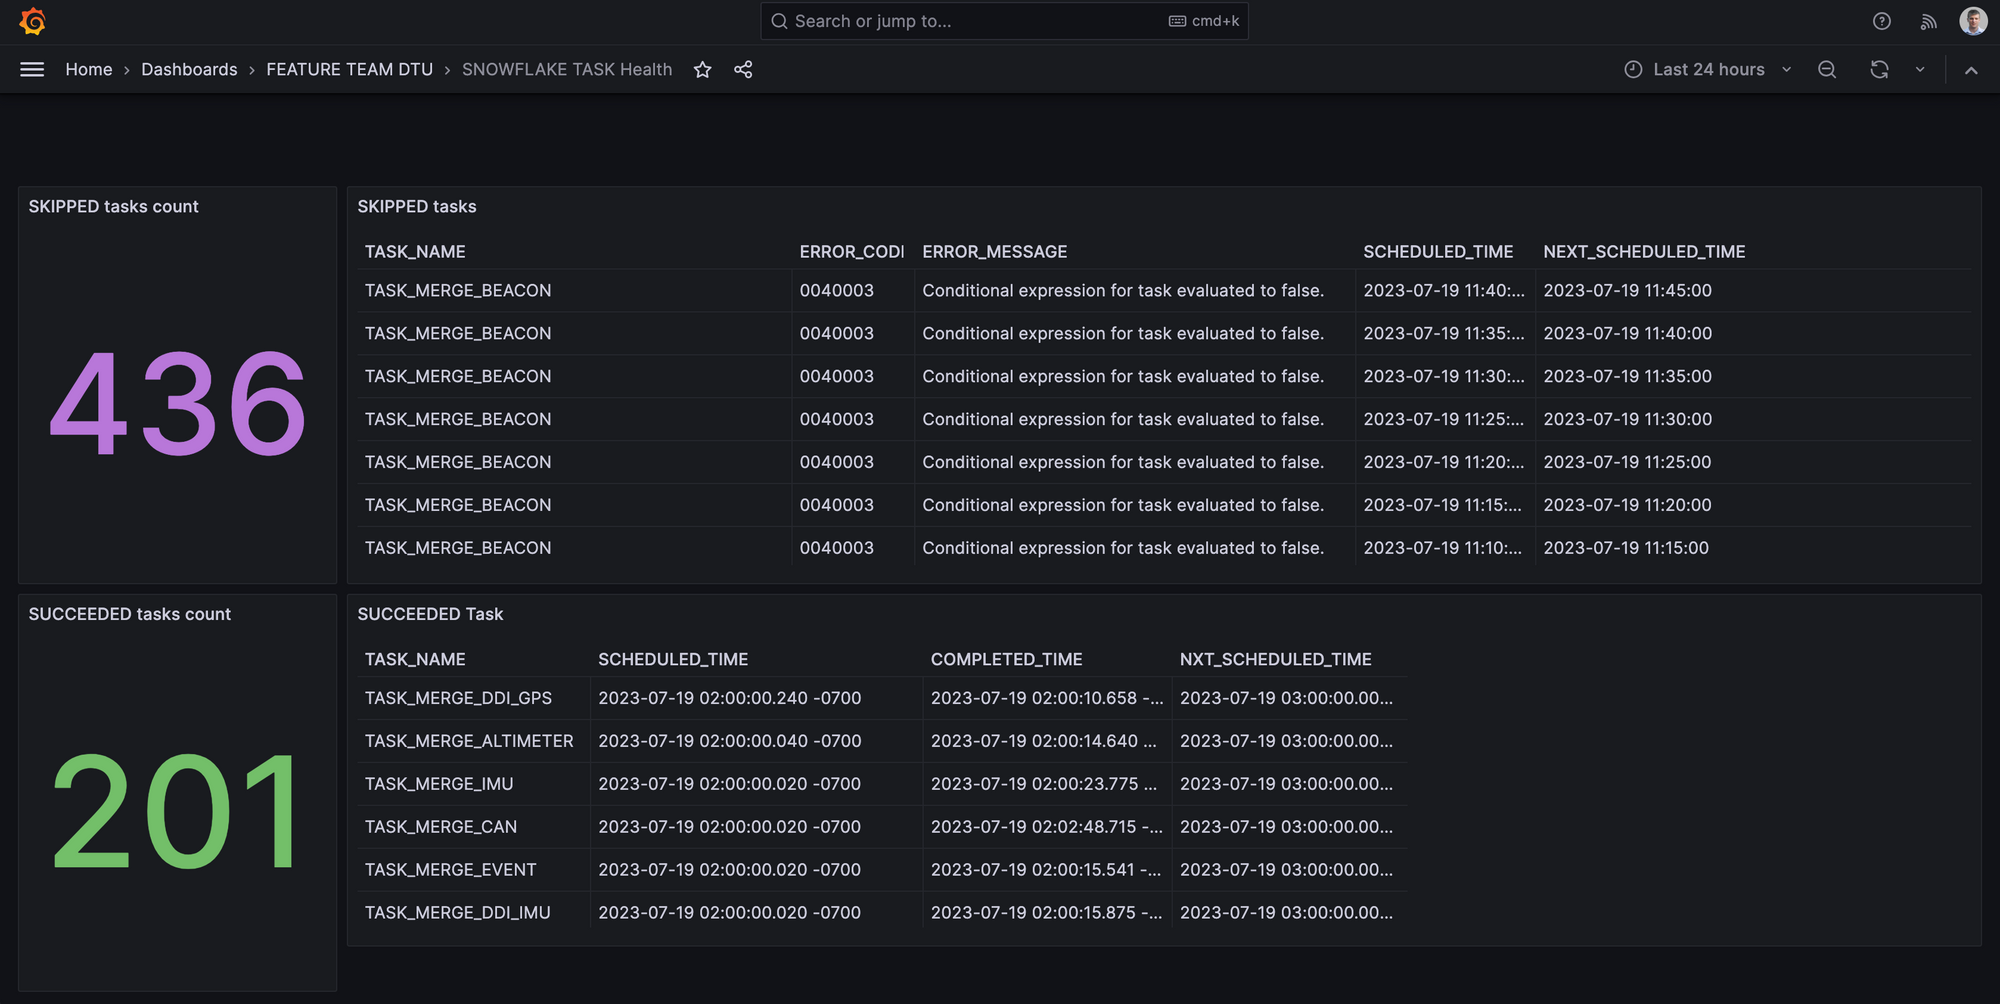
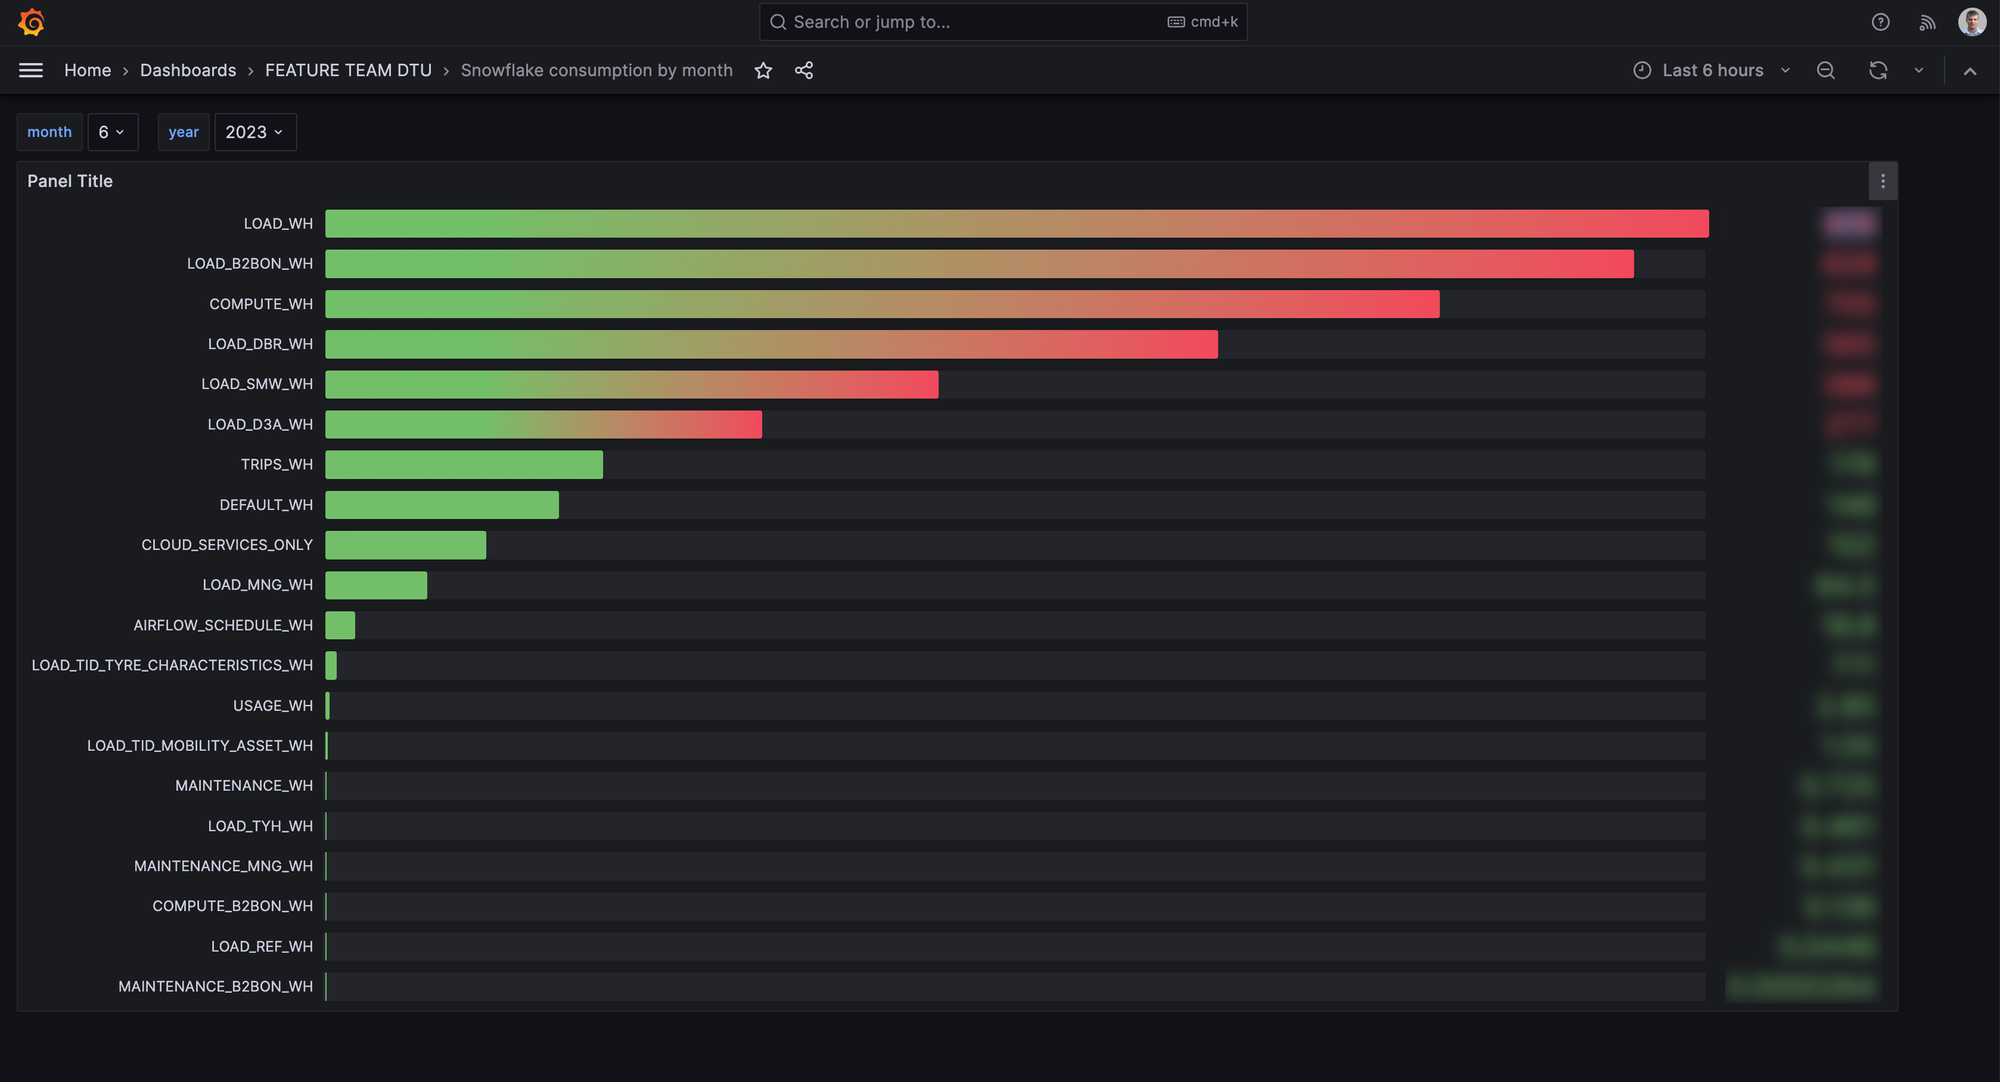
Some of the dashboards used with Snowflake as datasource
I continue to support this plugin with improvements from the community, as well as introducing new features like OAuth support which is coming soon. So, stay tuned for regular updates and improvements that will assist you with your data visualization tasks.
Thanks to the Kaizen Time spent on this topic, it greatly improved our monitoring stack and enabled me to learn and put into practice Go and React.