
Moving from orchestration to choreography - Part 2


In the first article of this serie, we've been through the preliminary work to convince our organization to move from a central orchestrator (implemented with a Business Process Management tool) to a choreography of micro-services.
This second article will focus on a critical step of the process (I should probably use a different word though): assembling the team and get ready to do the work and this during the first COVID-19 lockdown. I will also start to share some of the technical durty details behind our solution. Ready to take off?
But before we get started
Let's look at the problem we had to tackle.
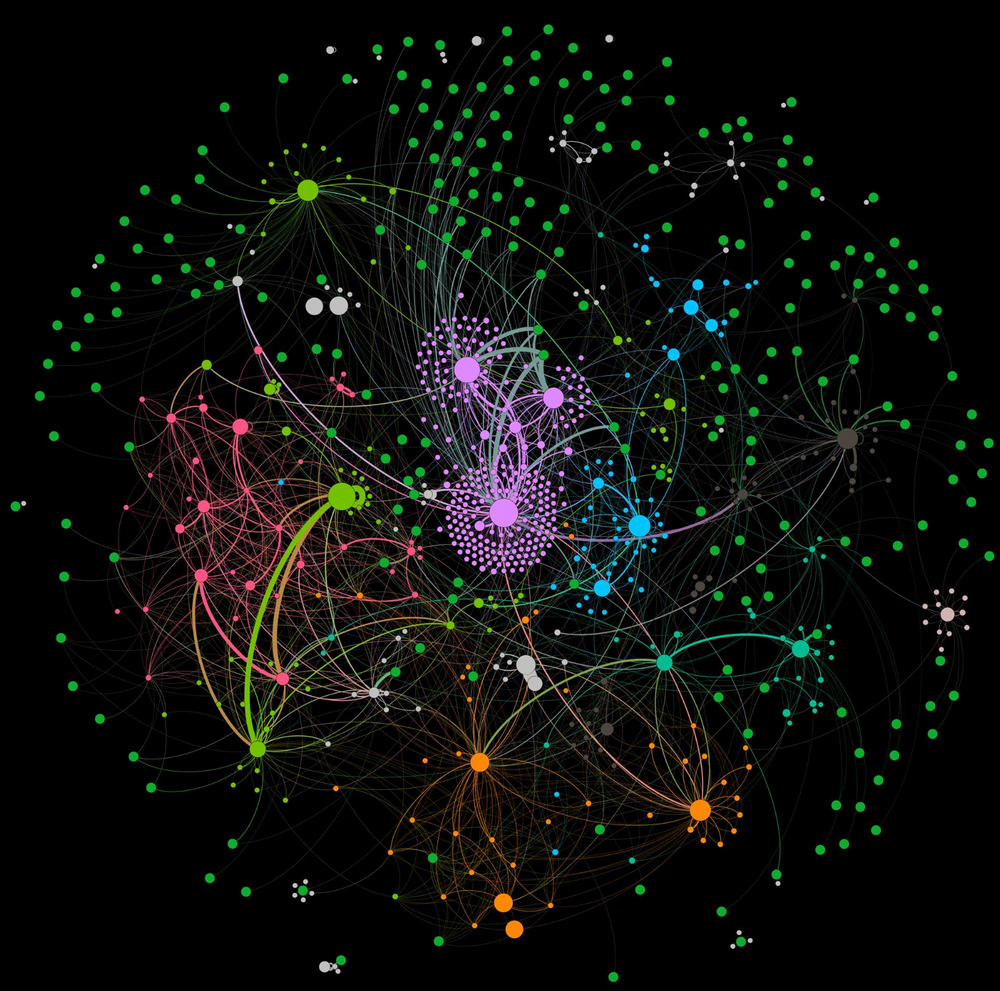
Who said IT is not an art? The above picture is a dependency graph of our Information System. The pink constellation in the middle represents our ERPs and as you can see we have 3 main instances (one per region). Our central orchestrator, DOO, is just below with the orange constellation: as you can see DOO is a central piece of our execution domain being interconnected with many many systems.
The challenges we were facing was: how to re-build our orchestrator using modern technologies without impacting this huge ecosystem?
But not only we had to deal with this central positionning problem, there was also the size of this system and the activity flowing in. Keep in mind that behind the "lines orchestrated" metrics, there is a significant part of the Michelin turn over. Here are some of the key figures to give you an order of magnitude:
- 25 K lines orchestrated per day representing 275 K process steps completed
- Peak: 140 K inbound events in one hour
- 39 JVMs and a 5 To data base
- 150 composites to integrate with external systems, 100 File Transferts, more than 50 ESB flows & 20 ETL jobs
Quite significant right ;)
So how to tackle this problem? I would say first things first: let's assemble a capable team.
How to assemble a team right in a COVID lockdown?
Assembling a team is something critical. You have to get the right skills and experience mix to be successful. In our case, we were looking for Kafka streams knowledge and people being able to re-build our business processes but with an event driven architecture and micro-services. Those skills are not so common but because we did a proof of concept to demonstrate that our micro-services based choreography was a good idea, we had some developers that started to know the technology. We also decided to get the benefits from the Confluent company through professional services. A solid tech lead was hired not because he mastered the streaming approach but because he had the reflex we needed: design, testing & operability. To complete the team we needed a pure devops leader as we wanted to automate everything right from the beginning. At the end, we got an hybrid team made from Michelin people and different partners folks.
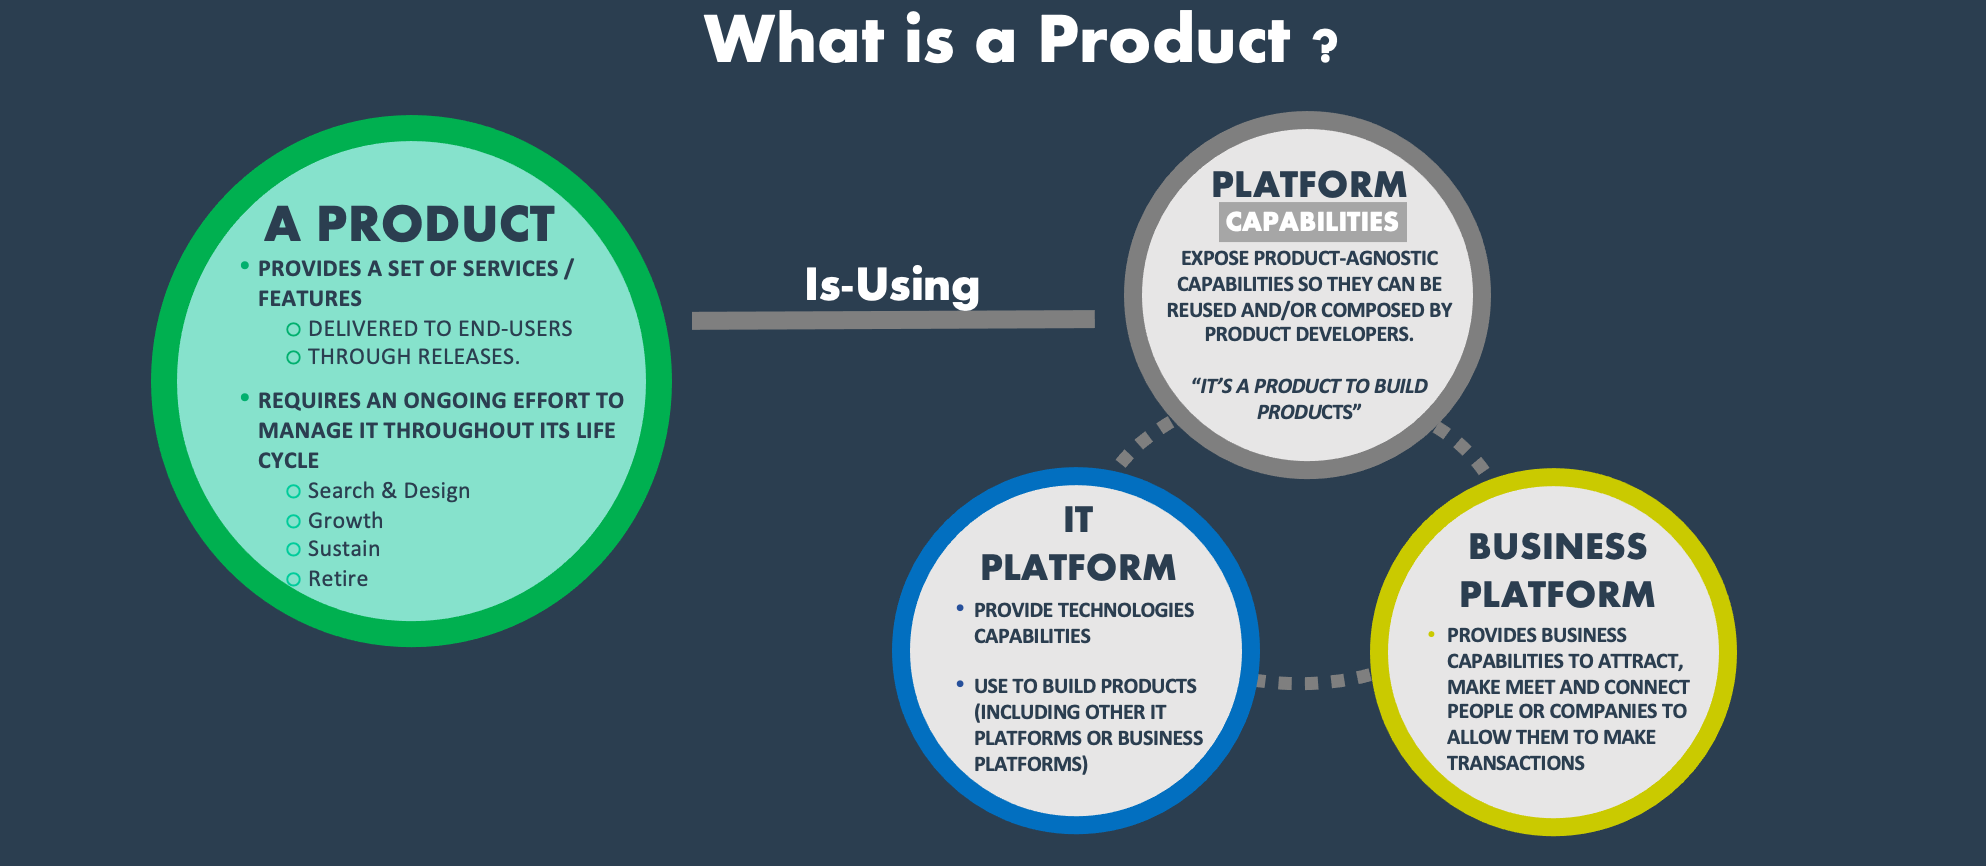
Having people is one thing but making them work in the same direction to deliver the right product is a different one. At Michelin, we use a methodology to create a team called scoping 360, inspired from Octo technologies. It's a set of inclusive workshops designed to assemble a team and align it on a product to delivery. By product we mean
a set of services / features delivered to its community of end-users through continuous flow of releases, during all its life cycle, from ideation to retirement, in order to continuously deliver value and enable continuous change & agility.
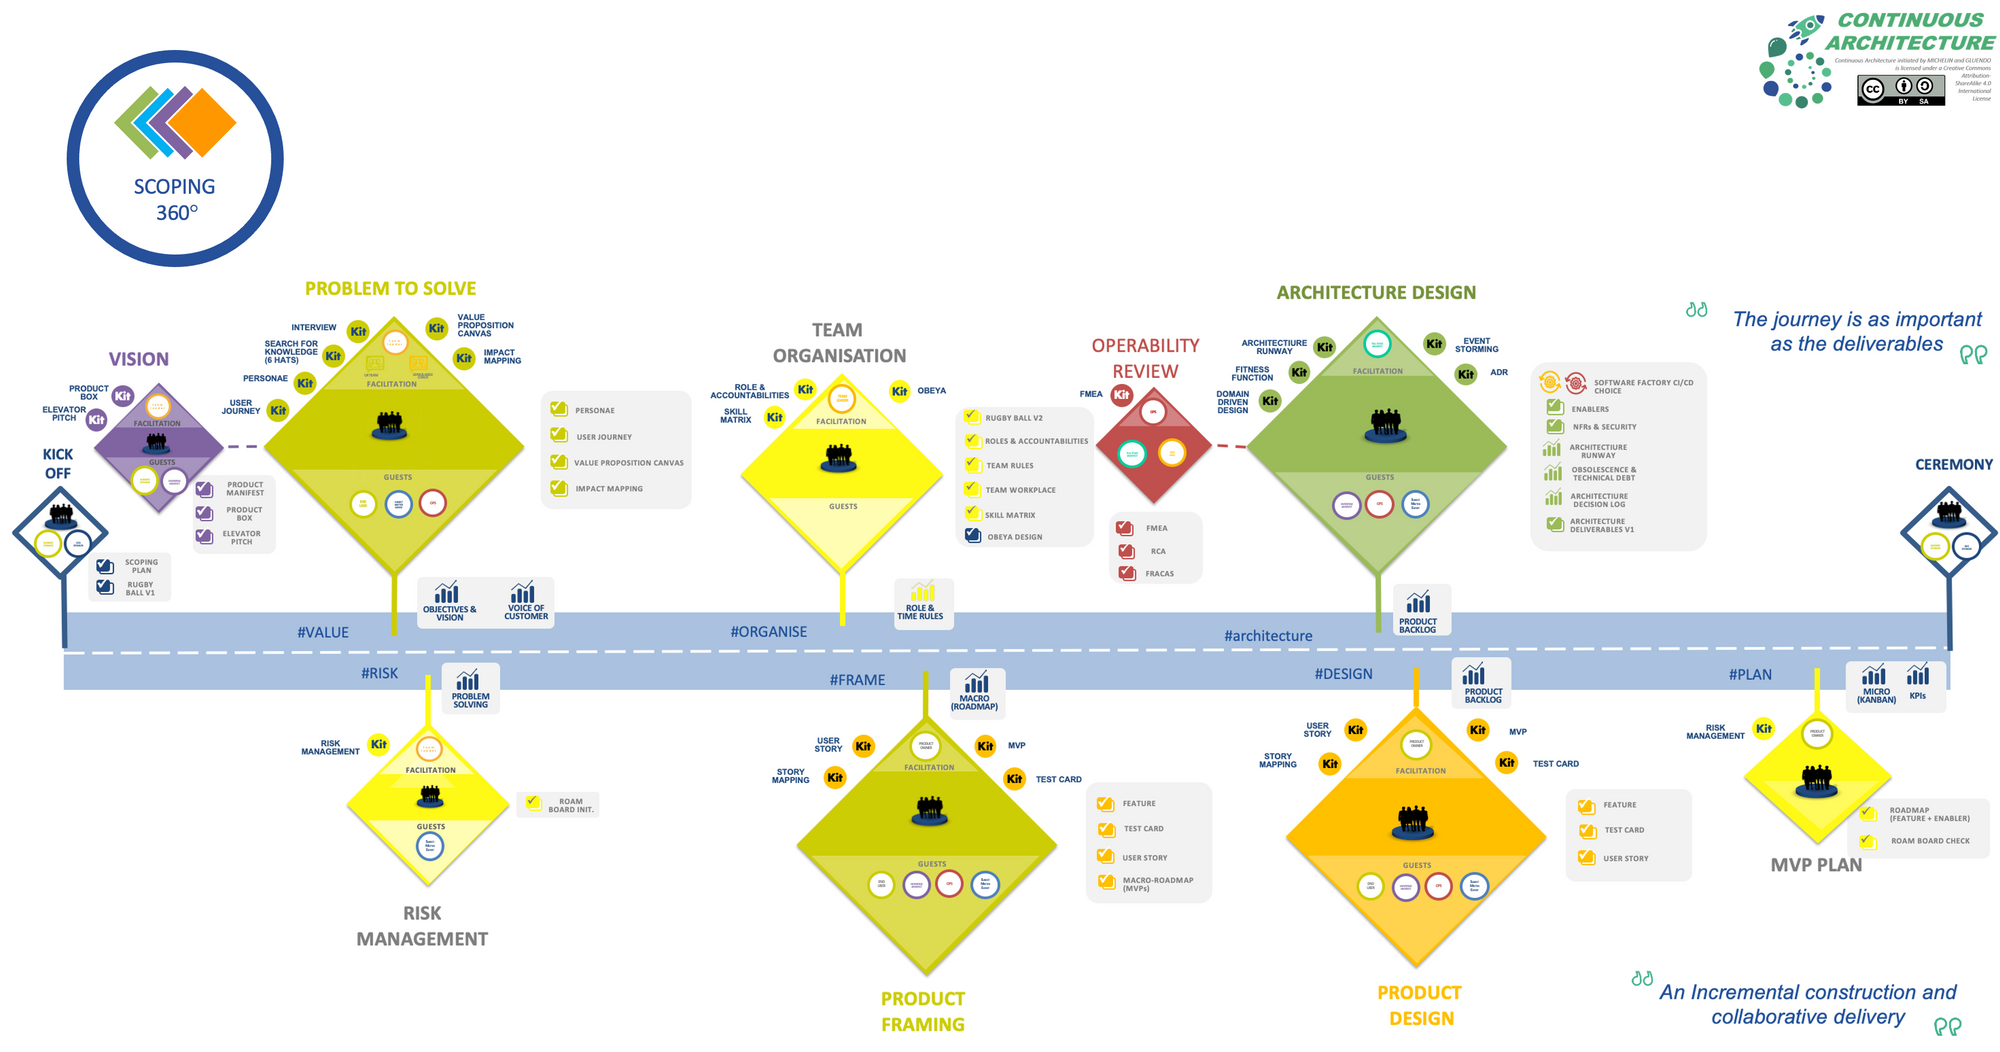
The below timeline illustrates this approach. I won't detail it too much as Thierry Fraudet, our senior IT Fellow, will do it in a coming article. But keep in mind that it starts with aligning every one on the product vision. Then go and find end users to discover what are their problems and pains. Up to structuring your backlog with a story map and finally define the first Minimum Viable Product to deliver.
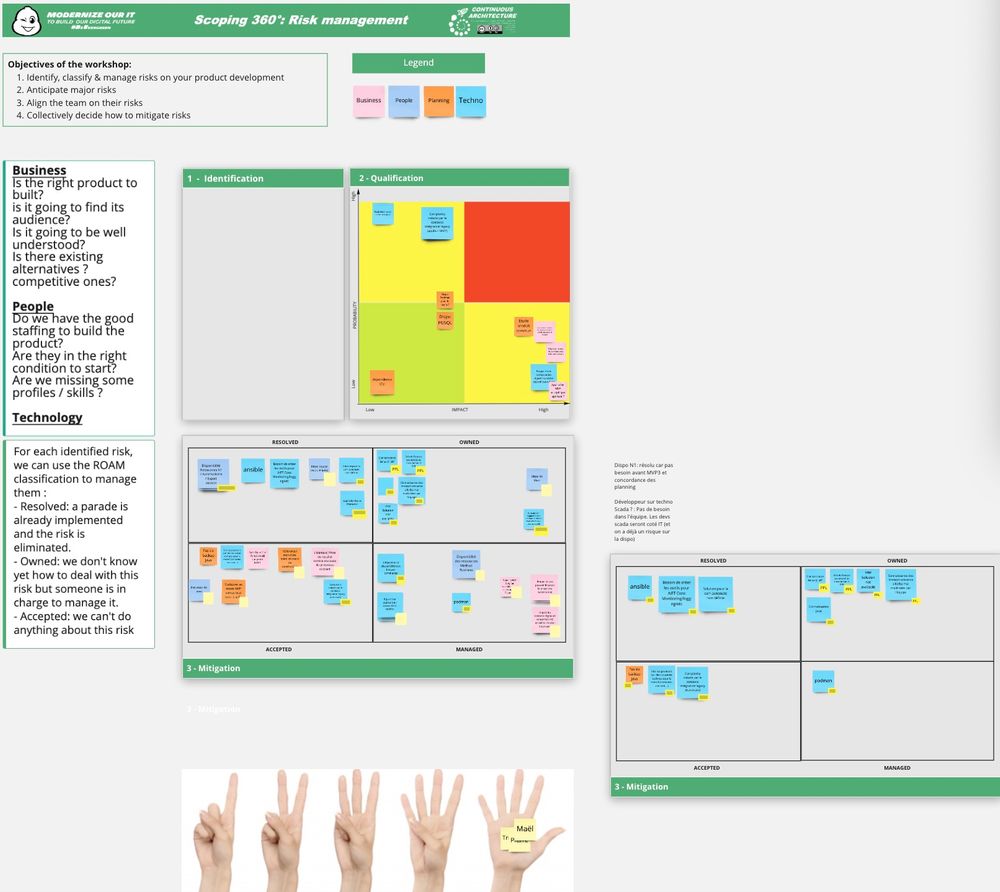
In a normal situation, these workshops are being held in a location with everyone. Obviously because of the COVID-19 crisis we had to do it remotely. Luckily, Michelin is a Microsoft shop and we were using Teams for a while now. The remote communication was ok but how to lead a workshop that is normally done using white boards and post its ? A new set of digital tools came to the rescue. Here I have in mind Mural or Miro. This kind of tool was absolutely key to get attendees involved and still be able to co-construct. Below one finds an example for a risk management workshop.
We've been through the different workshops completly remotely only using Teams & Miro. But now that we can reflect on this, we discovered or re-learned different things on what it means to be remote
- having such workshops in these conditions can be exhausting. You should limit to 5 or 6 hours a day maximum otherwise attendees won't be very productive
- keep some time for inclusive games and more generally speaking to have good time.
- do not forget that it could be difficult for some attendees to participate in such conditions. Animators must be very cautious and detect those that remain silents or pay special attention to their reactions if cameras are on. Believe me, it could be quite exhausting for aninators too as you've to keep your eyes & ears all opened even more that in a traditional workshop.
- assembling a team requires to spend good time together for real. Whether it's sharing a good meal, make sport together or get a beer. Obvisously we could not do that. Do not neglect those moments and if you can't have them try to make them happen at some point later.
Let's deep dive a little bit
An event storming to start with
Right after the vision workshop where we used tools like impact mapping, lean canvas & elevator pitch, we went through an event storming to re-discover the existing processes and better grab the problem to solve. The figure below represents the intrazone internal order process in charge of the deployment of our products (ie tires) from our plants to our warehouses.
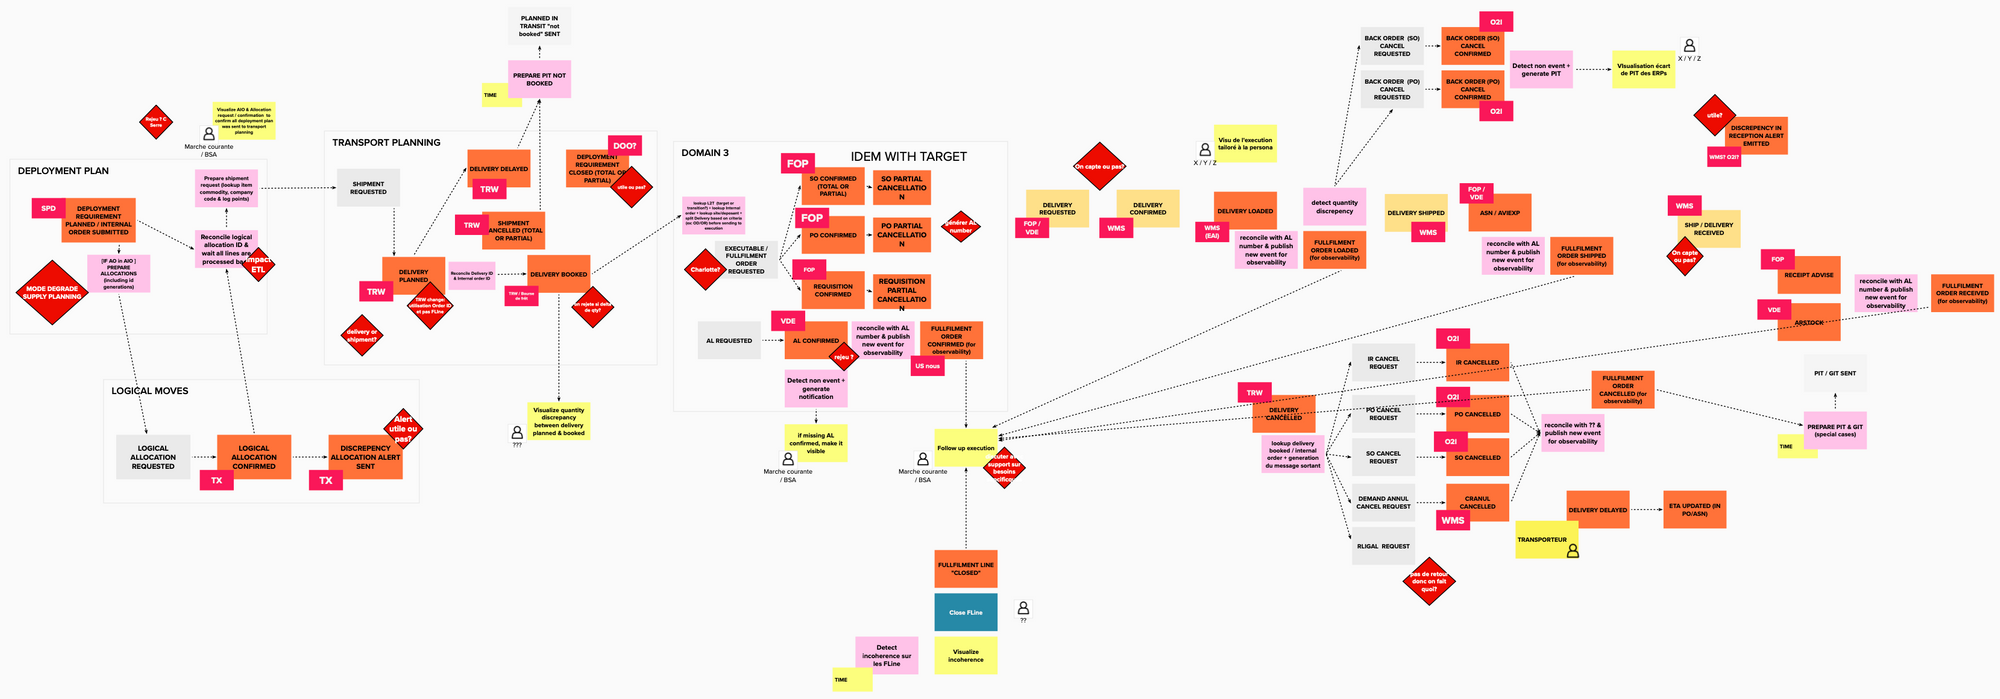
Some findings from this workshop:
- Event storming was really the right tool to start with as our business processes can be described with business events
- The language was everything but ubiquitous between team members. Business folks kept using their "legacy" language mostly influenced by the legacy systems our DOO orchestrator was supposed to hide. While IT architects tried to enforce terminology coming from market standard like APICS. Beyond this opposition, as long as Business & IT folks from the same team do not speak the same language, we had a problem. In such complex environment, not using the same word for the same thing can lead to severe issues.
- When you're coming from a business process management solution, you have a tendency to do the event storming with the orchestrator view point. During the workshop, I had to constantly recall to the audience that we were not here to document inbout & outbound flows of the orchestrator but to describe the business domain through business events. That was hard but necessary.
With an event driven architecture, decomposing the overall system into business domains could be tricky. But in our case, the different business domains (so the bounded contexts) were almost already identified. Indeed, by nature our business processes are transverse to the main business domains like deployment planning, transport planning ... So the choice of the domain was quite obvious in our case. Some could argue here we really comply to the Conway's law and I would agree with them ;)
We won't detail here too much the User Research we conducted as our orchestrator was a very technical product only used by a few IT folks. The business users were mostly consuming data coming from it with various reporting & BI tools. We limited a bit this phase and as you'll discover in the third article, this was probably a mistake we made.
The architecture
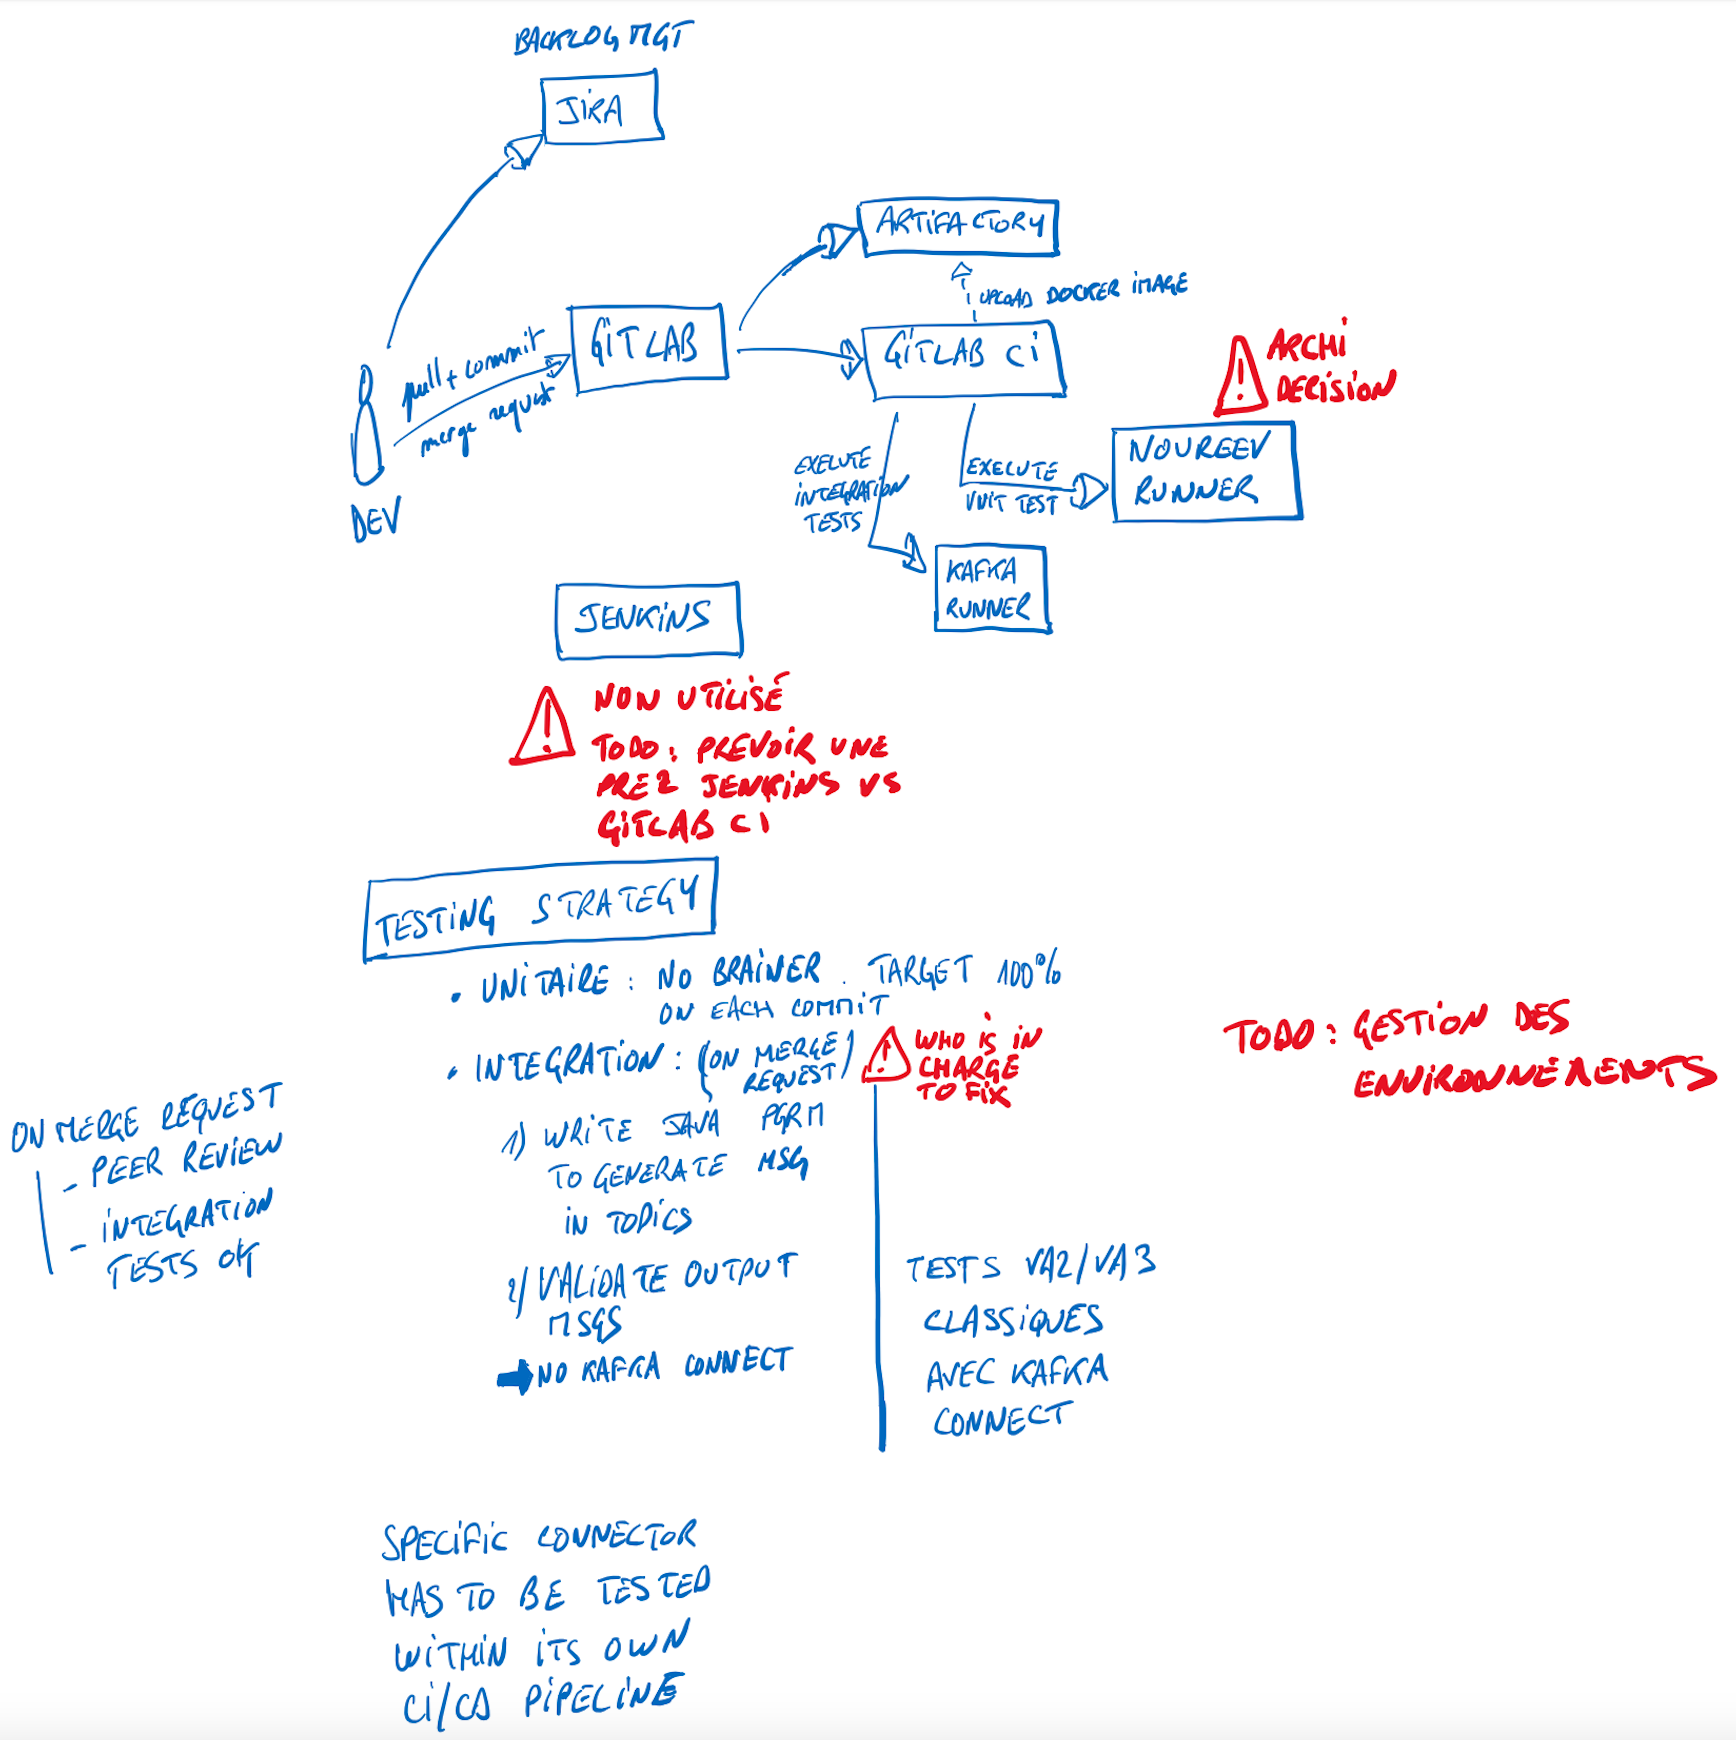
In the Scoping 360° methodology, the architecture workshop is a big piece usually held over 3 days. Here given the lock down and the size of the topic, we spent more time. To overcome the remote difficulty, I had to use my iPad to draw some schemas because, I don't know for you guys, but an architecture workshop without an ugly schema is not a real architecture workshop ;). You'll find below different drawings that helped us to define what we wanted to do in terms of integration, CI/CD, monitoring and observability. I apologize for them first because of my hand writting and the possible french bit & pieces.
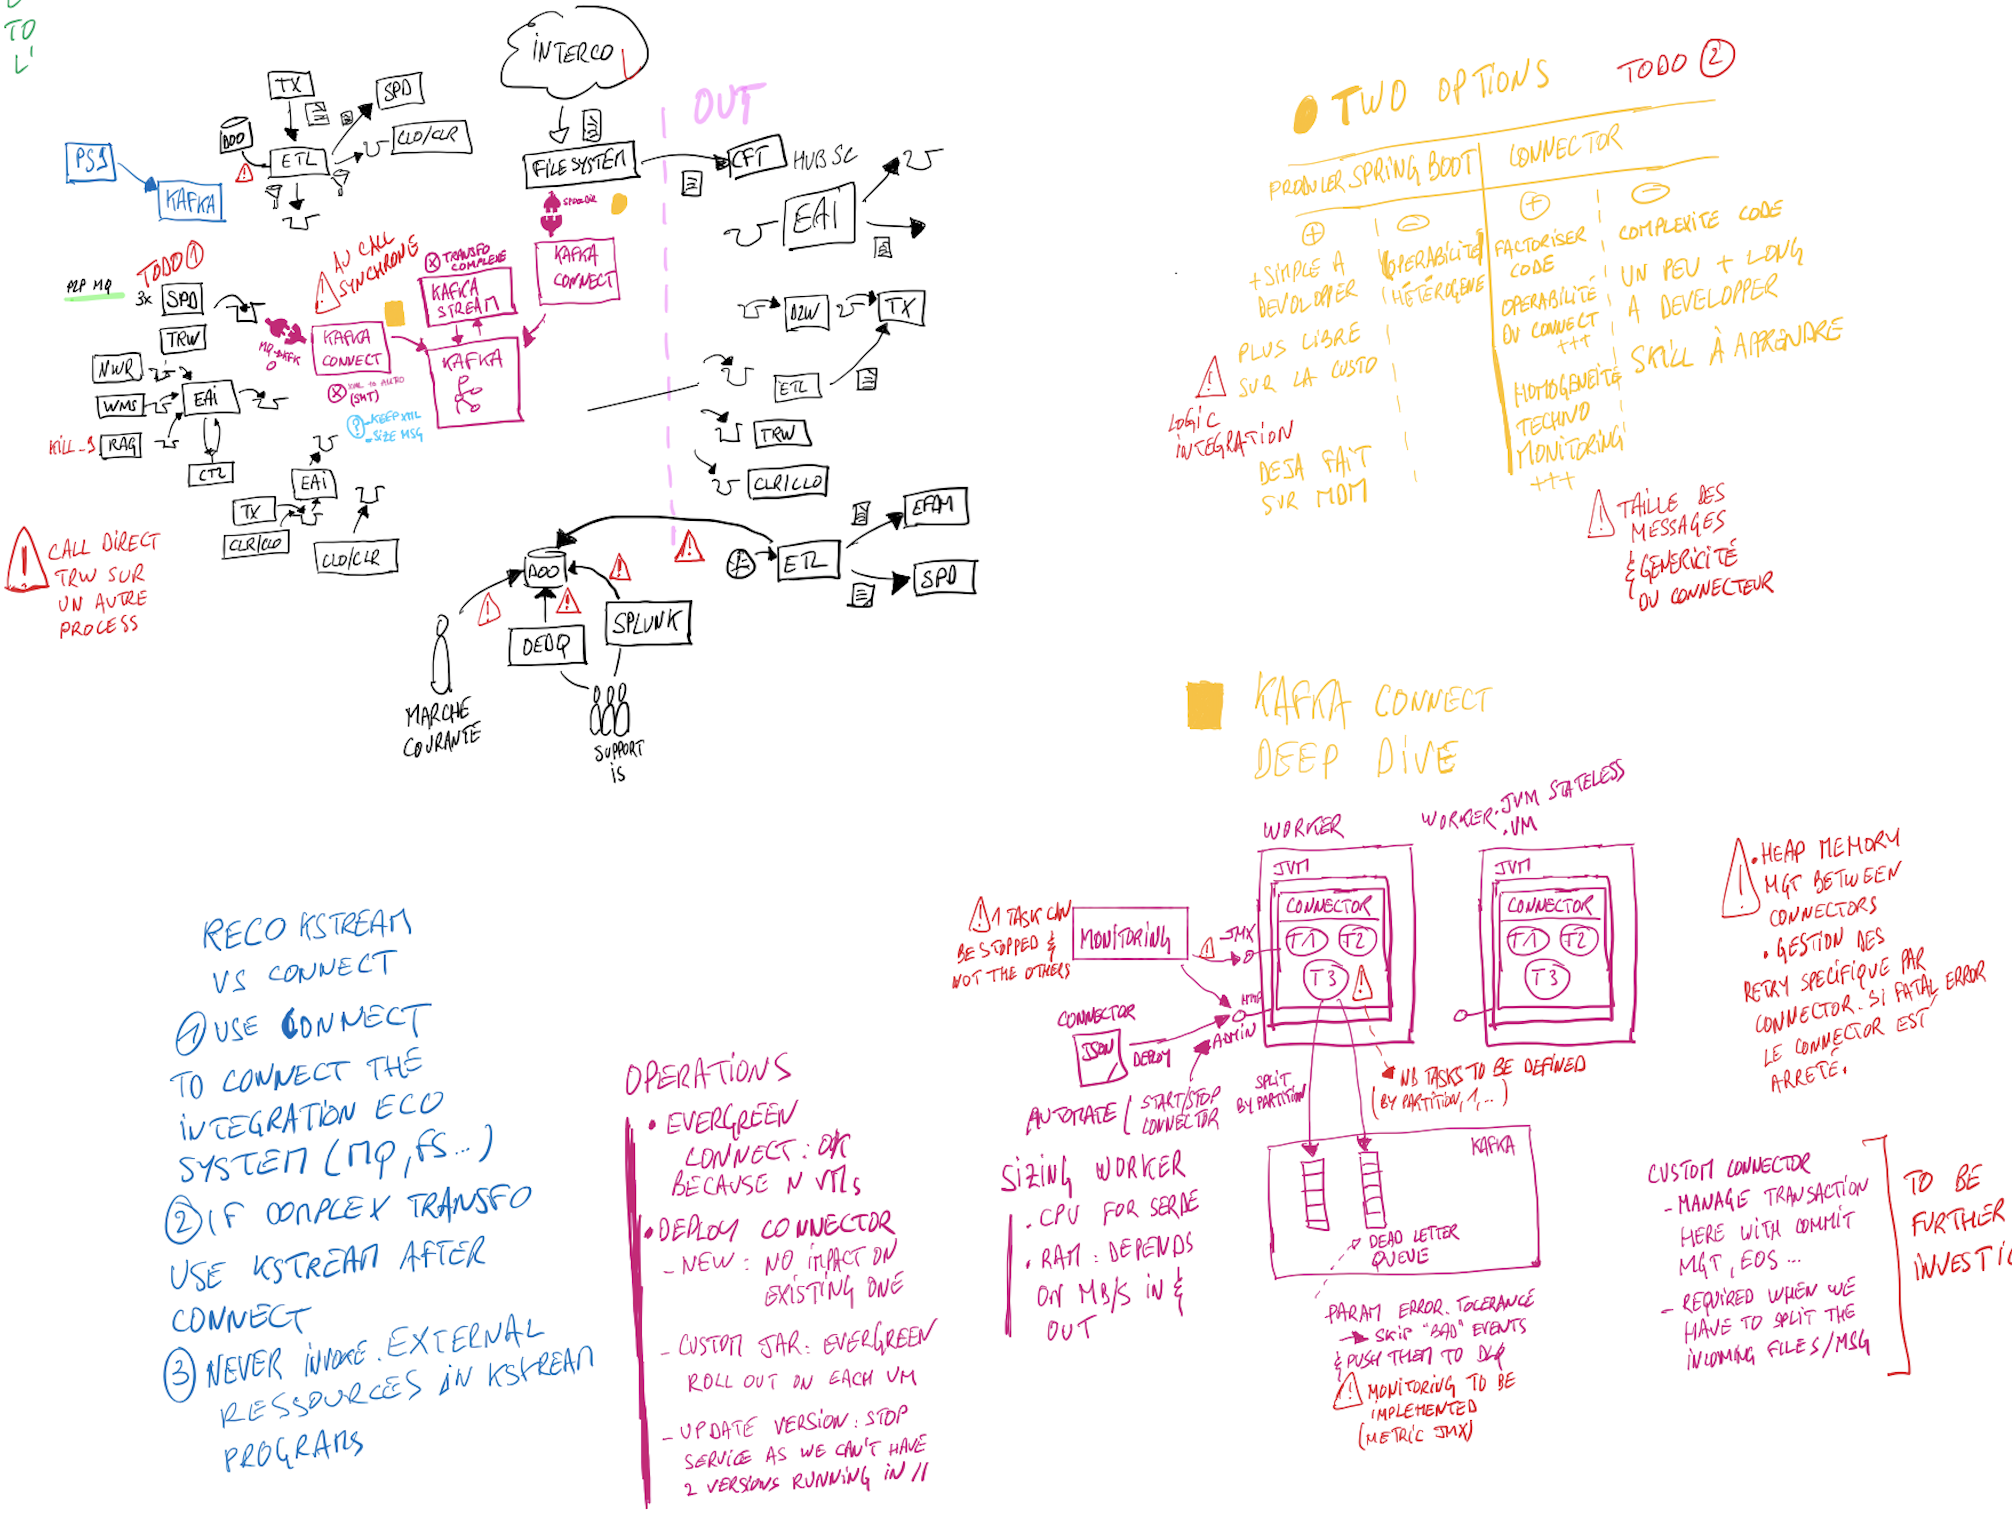
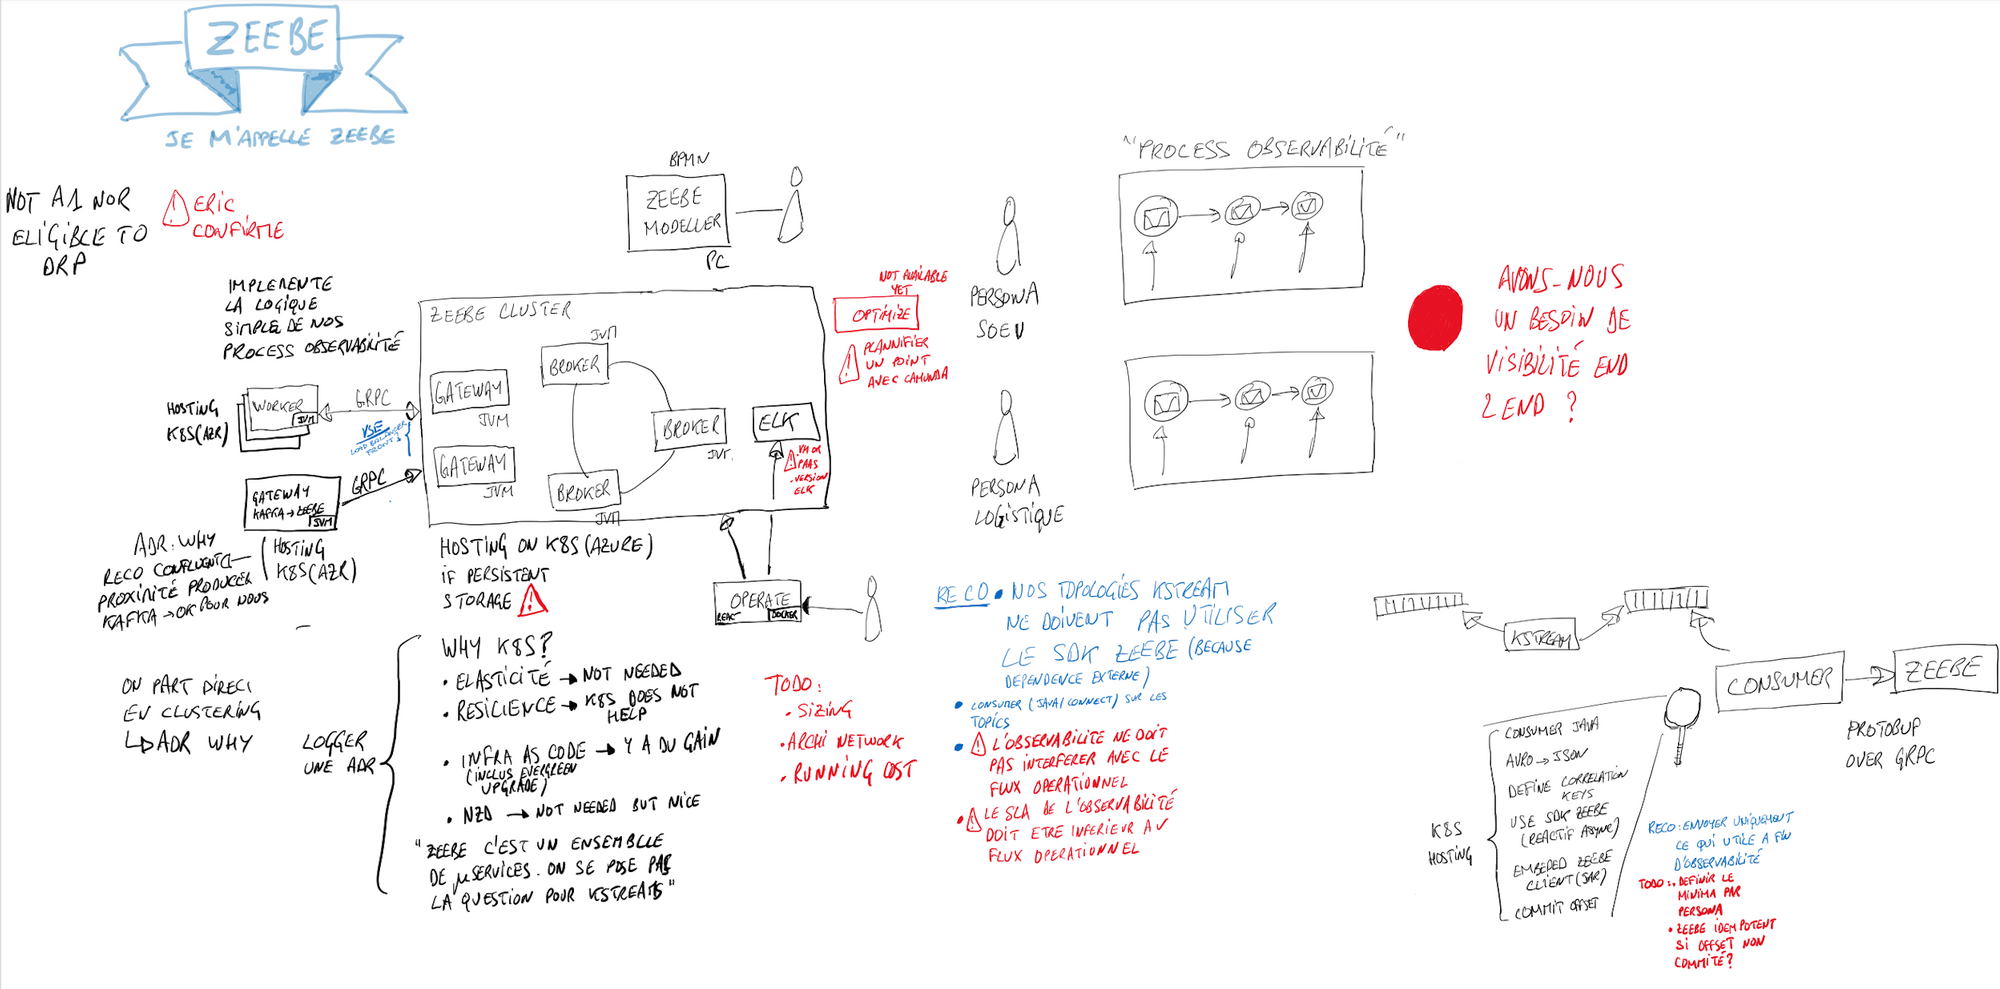
The beauty of the digital tools is that we can replace those drawings with more professionals image. And here is the recap of our architecture.
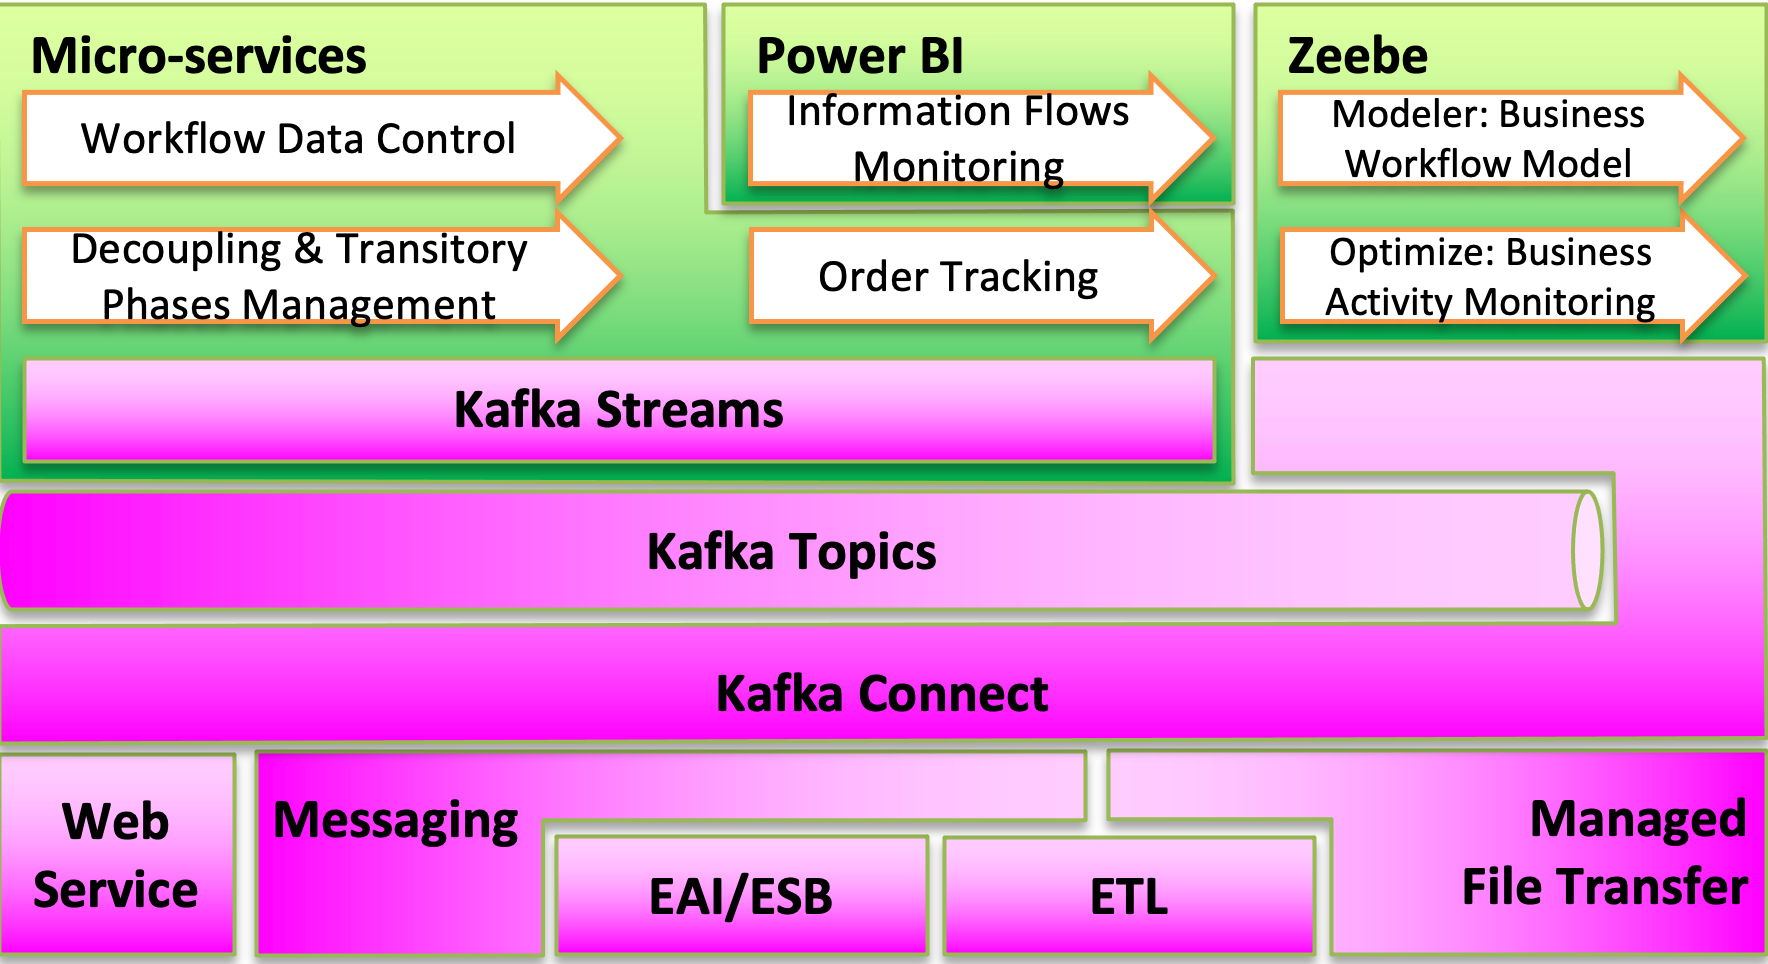
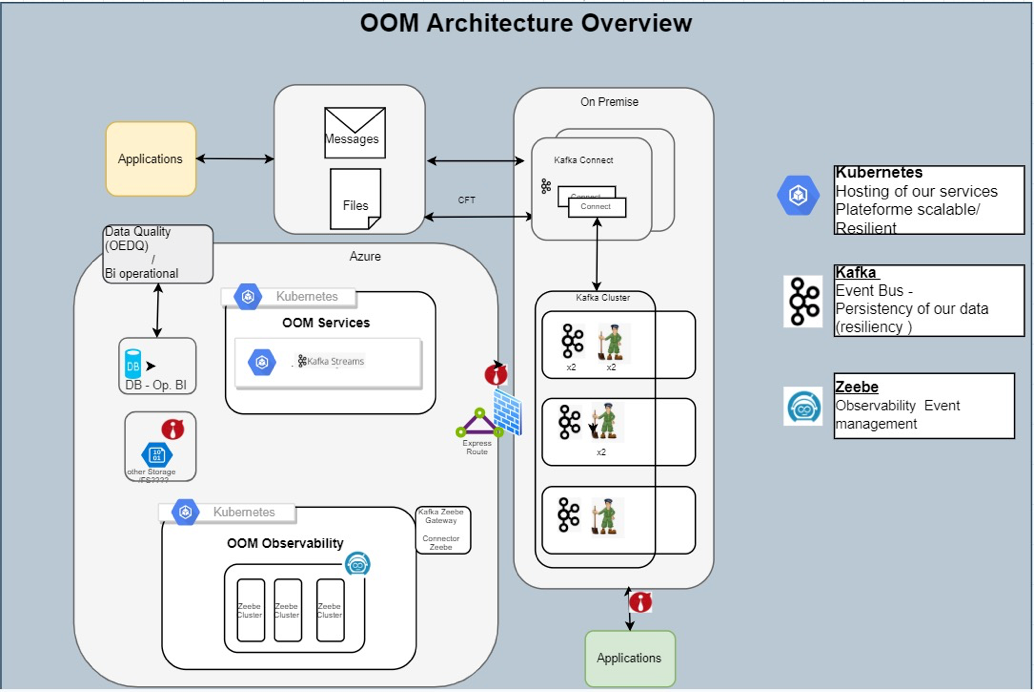
The below part of the schema represents the integration ecosystem (in terms of technologies) we have to deal with. And here, Kafka Connect with its large set of connectors is a key component as it clearly ease the integration part. The Kafka broker is obvisouly at the center of our architecture. Inbound & outbound topics will be used by Kafka connect to read from and write to the ecosystem. While Kafka Streams micro services will contain the business logic to aggregate, filter, correlate ... business events. The upper right part is where the observability of the solution will be.
Technically speaking, our Kafka cluster along with Kafka Connect workers are hosted in our on premise data centers on VMWare hypervisors. We decided to not use Kubernetes for this hosting mainly because persistent storage was not fully ready in our K8S clusters at the time. All our micro services were developed in Java and hosted in our K8S clusters in Azure. The below pictures illustrates this.
Go to production regularly
The scoping 360° approach is designed to help teams to focus and make them move quickly. But we were caught by the reality quite quickly. Even if we wanted to adopt the minset illustrated by these 2 tweets (quoting Dwight Eisenhower and Matthew Skelton from Team topologies)
Continuous learning and planning
— Jonathan Smart (@jonsmart) June 28, 2021
over
A plan
An emergent mindset
over
A deterministic mindset
“Planning is indispensable.
Plans are useless”, Eisenhower#BVSSH https://t.co/yvUA3XQaSh
I think that "a plan", "planning", and "to plan" can be usefully replaced with "a description of our expectations", "describing our expectations", and "to describe our expectations".
— Matthew Skelton #BLM 💙 (@matthewpskelton) June 28, 2021
Expectations imply future adjustment, but for many people plans are fixed. #OODA
we had to deal with an ecosystem that was project oriented and then obsessed by plans and roadmaps. So the challenge for us was to describe the first MVP so the team can move quickly while communicating on further MVPs so program managers could assess the impact of what we were doing.
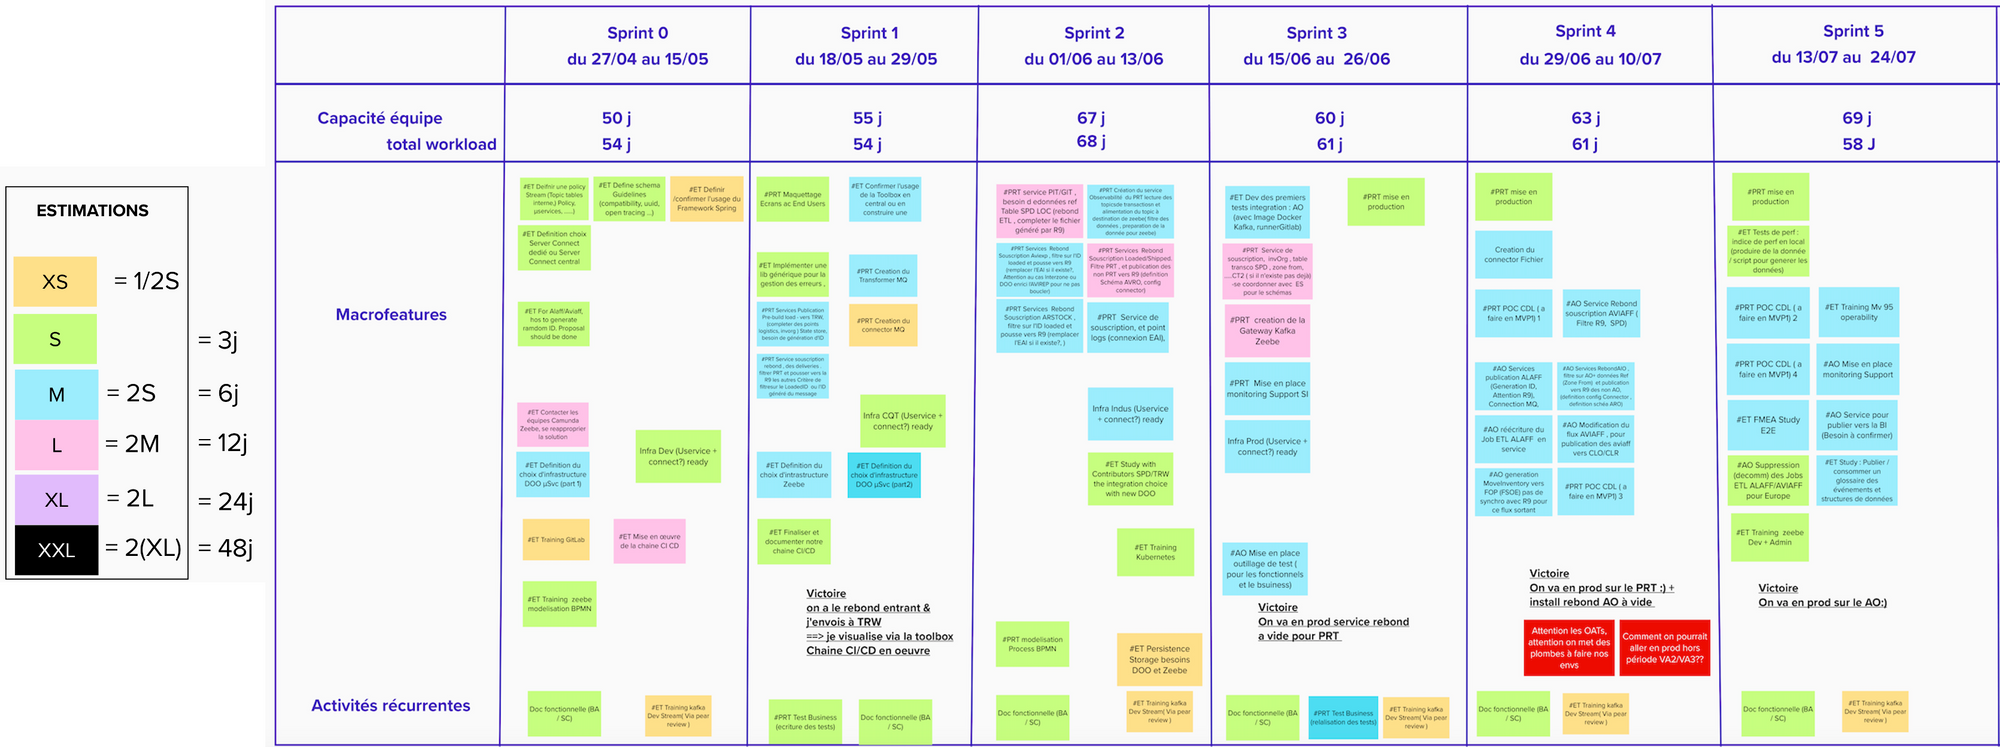
You'll find below a screenshot representing the content of the MVP1 (made of 4 sprints). As you can see for this short term horizon we tried to be quite specific: accurate team capacity, position user stories in sprint after estimating them relatively (we can't do better at the beginning of a team as we have no indicators on the team velocity) and try to make sure our hypothesis for the MVP1 could be met with the embedded user stories.
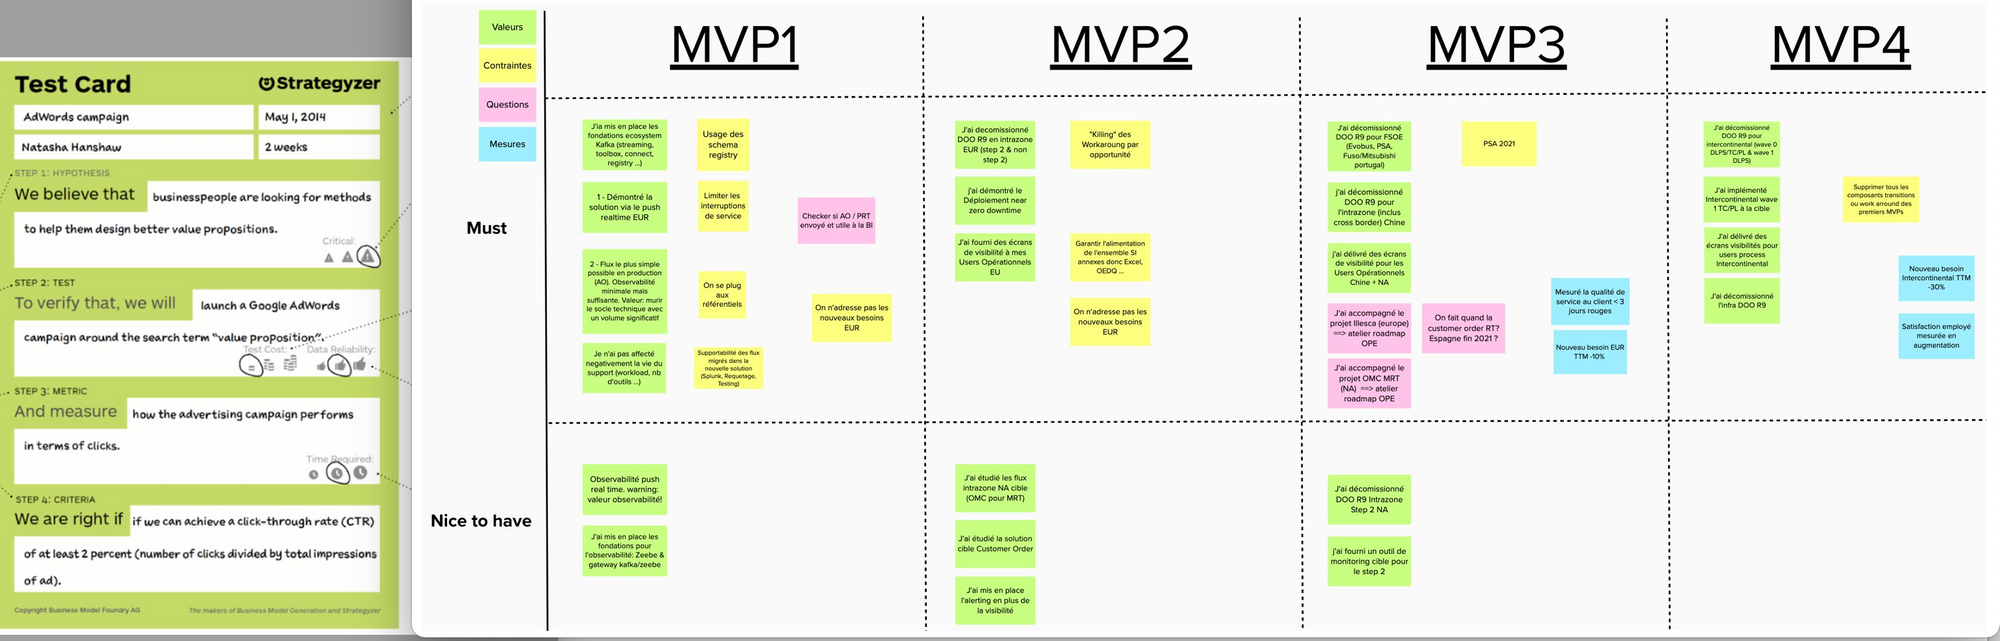
To describe the macro-roadmap, we could not be as detailed given that beyond three months time horizon everything is inaccurate. We decided to use the test card tools and describe each MVP with an hypothesis to verify. Then we tried to assign the right user stories to be able to verify it. Thanks to this approach we were able to communicate a roadmap but we made it clear that it was not an engagement from the team.
One of the biggest challenges here was to explain we wanted to deploy our MVPs in production. We wanted to achieve this to get a feedback from the field and avoid the big bang approach. If we don't go regularly in production, it means we are increasing the source code "stock". The further we wait, the bigger the change will be and the longer test phases we'll get. To win over, we had to explain how to mitigate the risk of frequent changes in productions. We'll explain this part in the next article of this series.
Automation & observability, a must in the microservices heaven
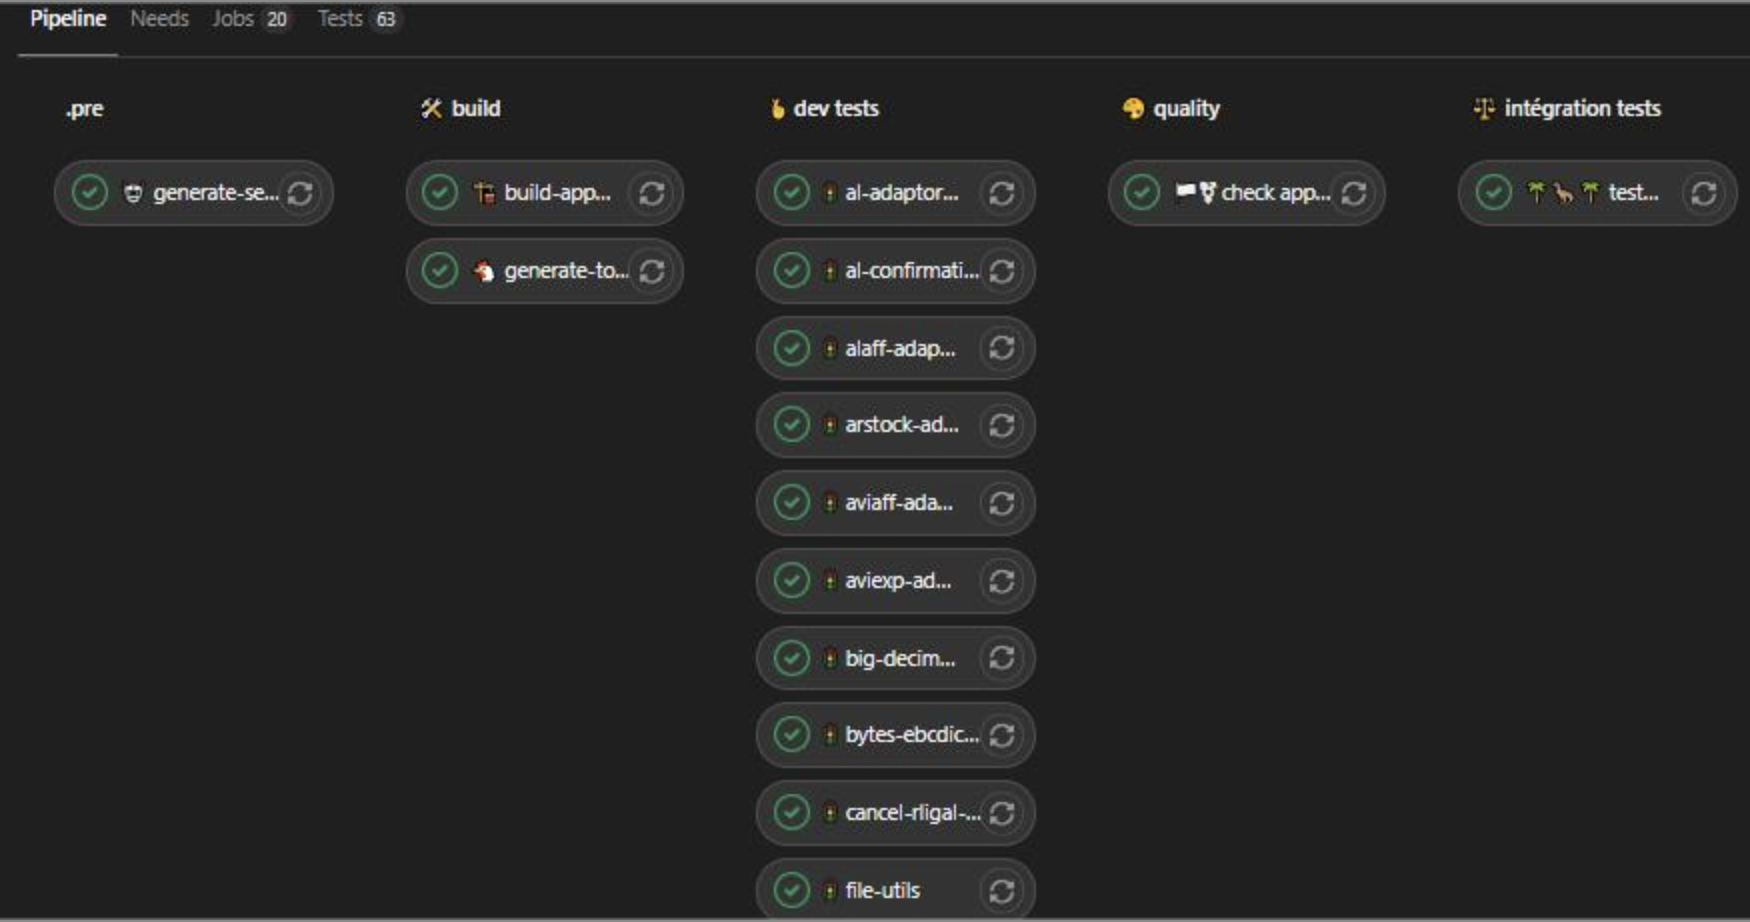
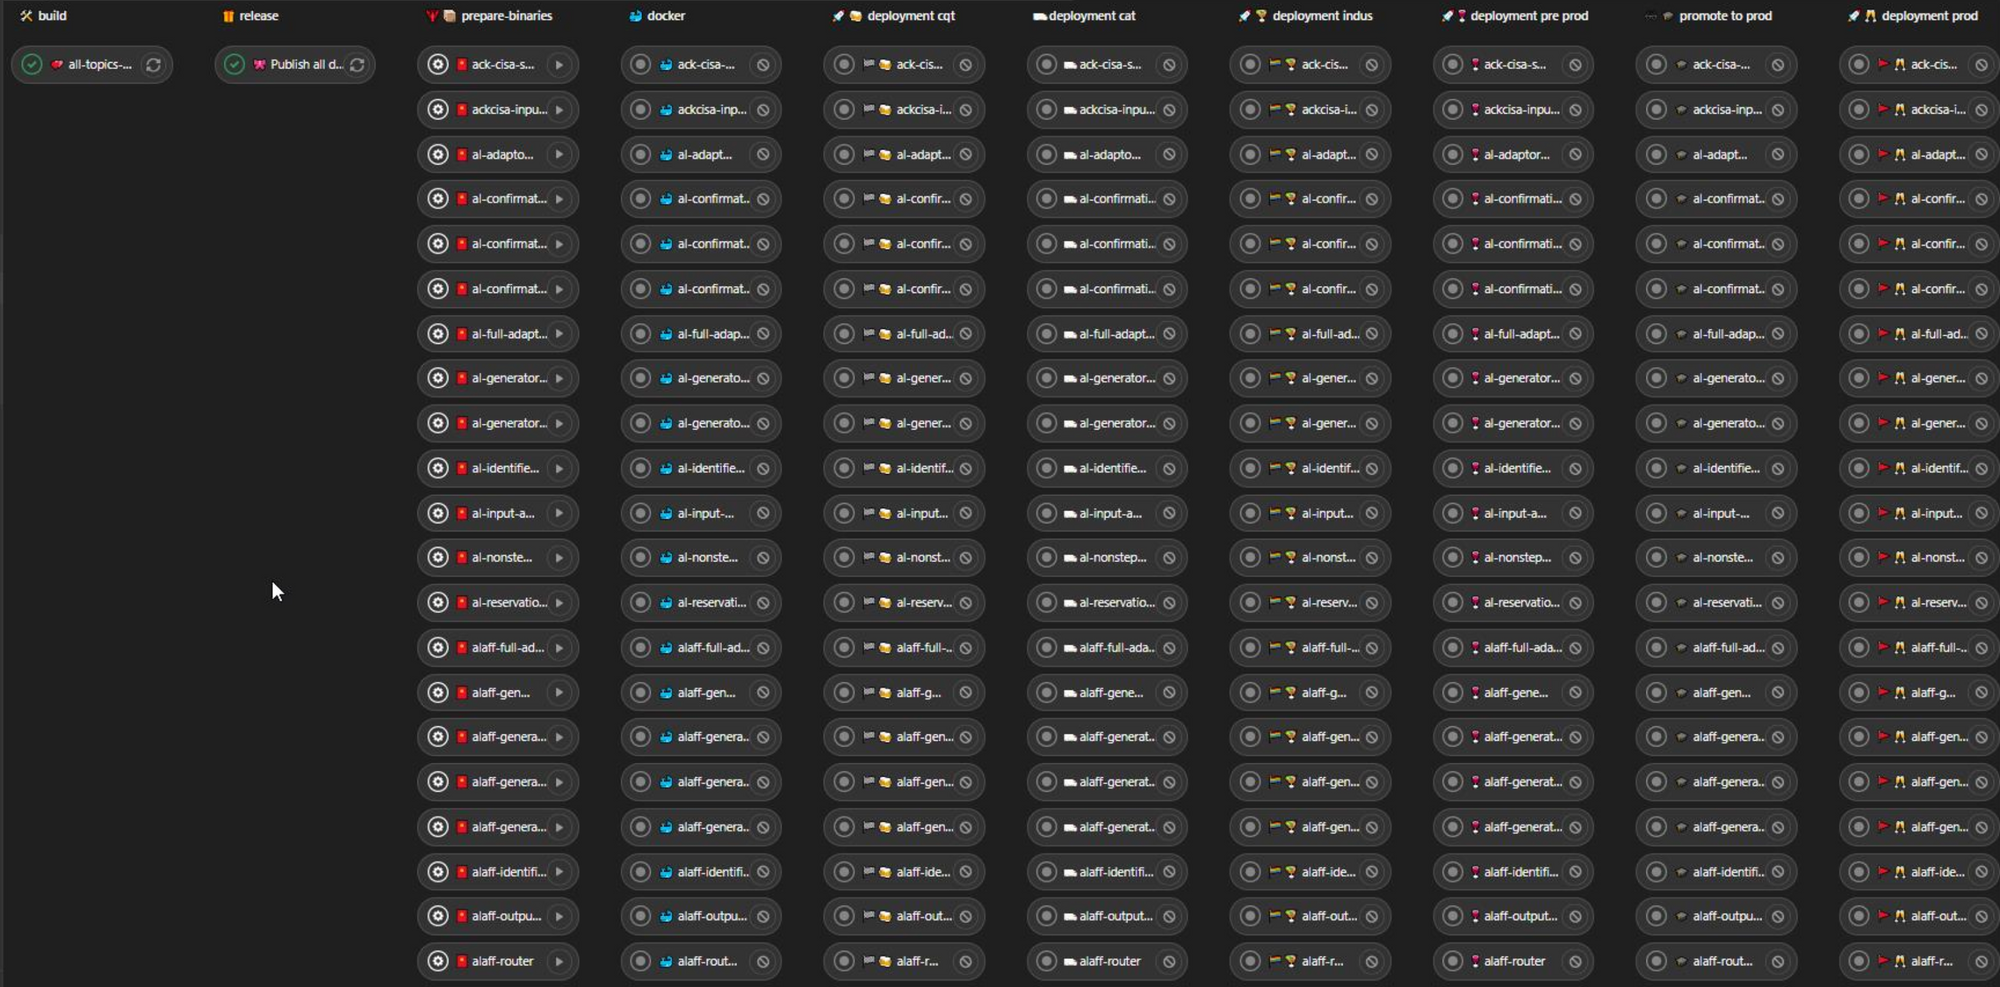
Given the number of micro-services and the integration flows we had to deal with, the number of deployments the team will have to perform, a fully automated CI/CD chain was a must. At Michelin, we use Gitlab CI and thanks to our DevOps leader, we were able to setup this chain completly. Below, you'll find two screen shots representing two pipelines: the first one illustrates a pure testing pipeline while the second is a complete release deployment.
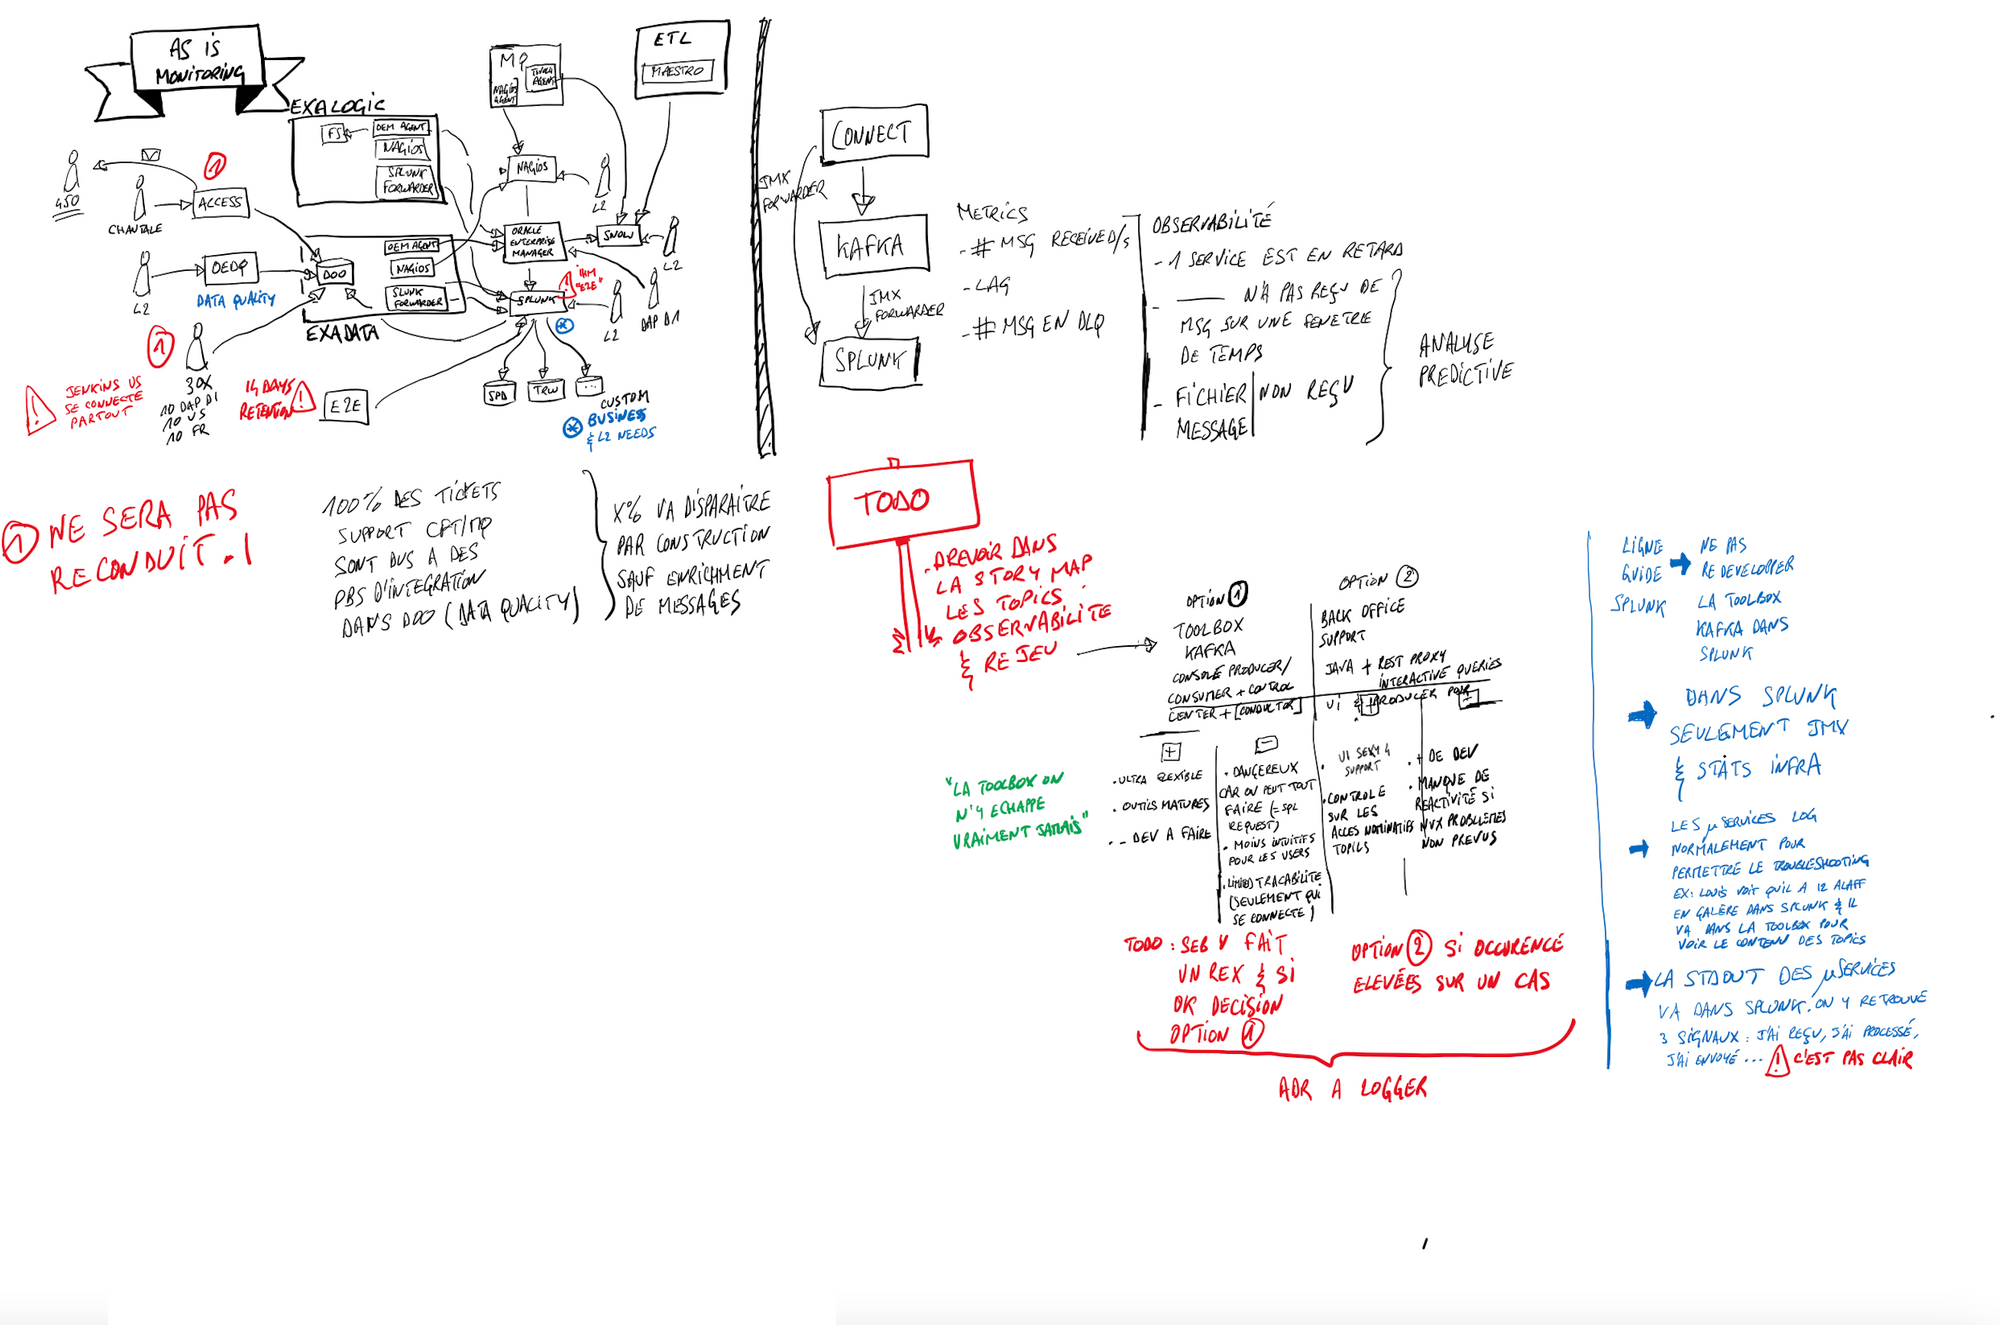
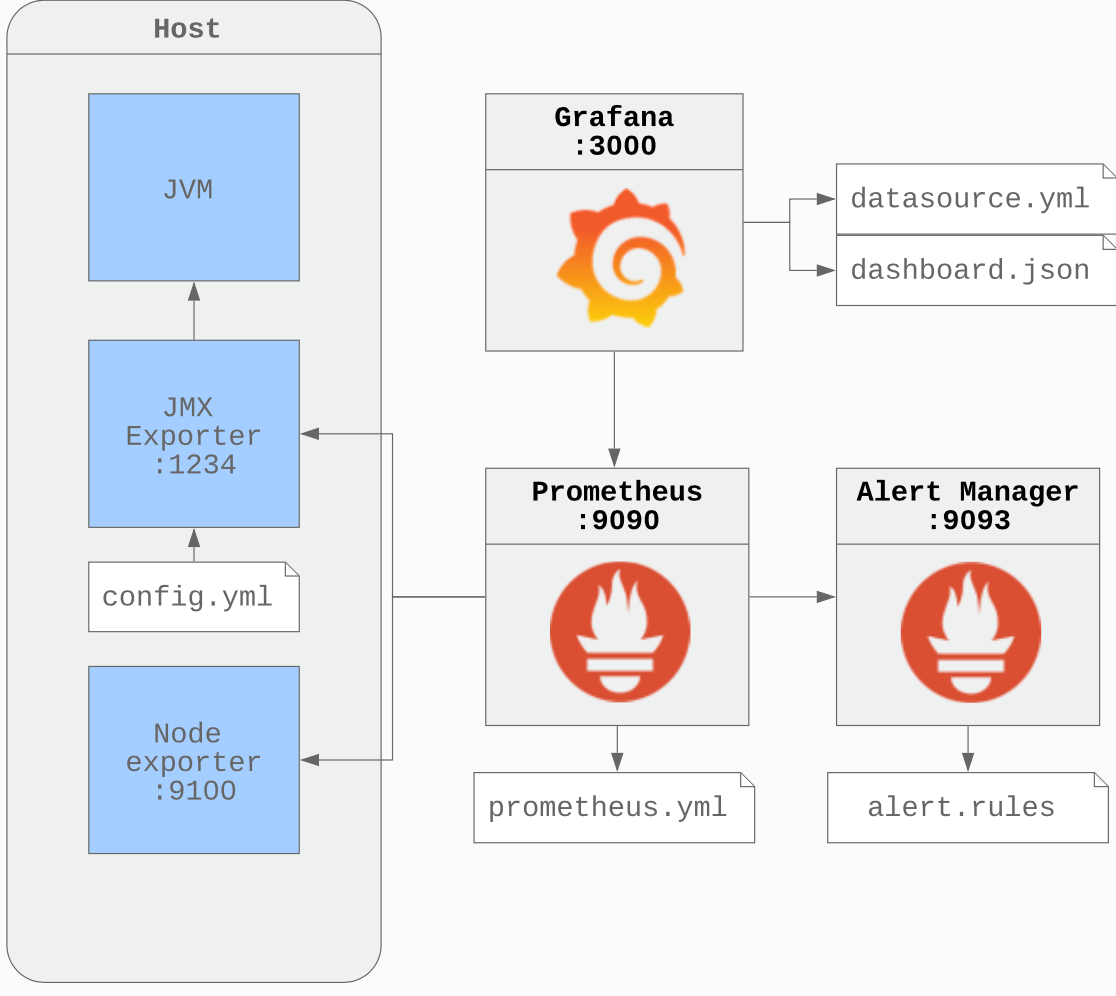
So building & deploying were ok but to be safe we had to monitor and observe our system carefully. It's no surprise that when it comes to monitor our Kafka ecosystem and our streams, we implemented the famous Prometheus-Grafana stack to do it. Following the recommendation of Jean-Louis Boudard (our Customer Success Architect from Confluent) and reusing the huge work done by Daniel Petisme (GitHub repo), we put in place this solution that use JMX metrics from Kafka JVMs and the dashboarding capabilities of Grafana to keep en eye on our Kafka clusters, connects etc. And it works extremely well. Below, you'll find the general principle we used to implement the Prometheus & Grafana stack. Nothing fancy.
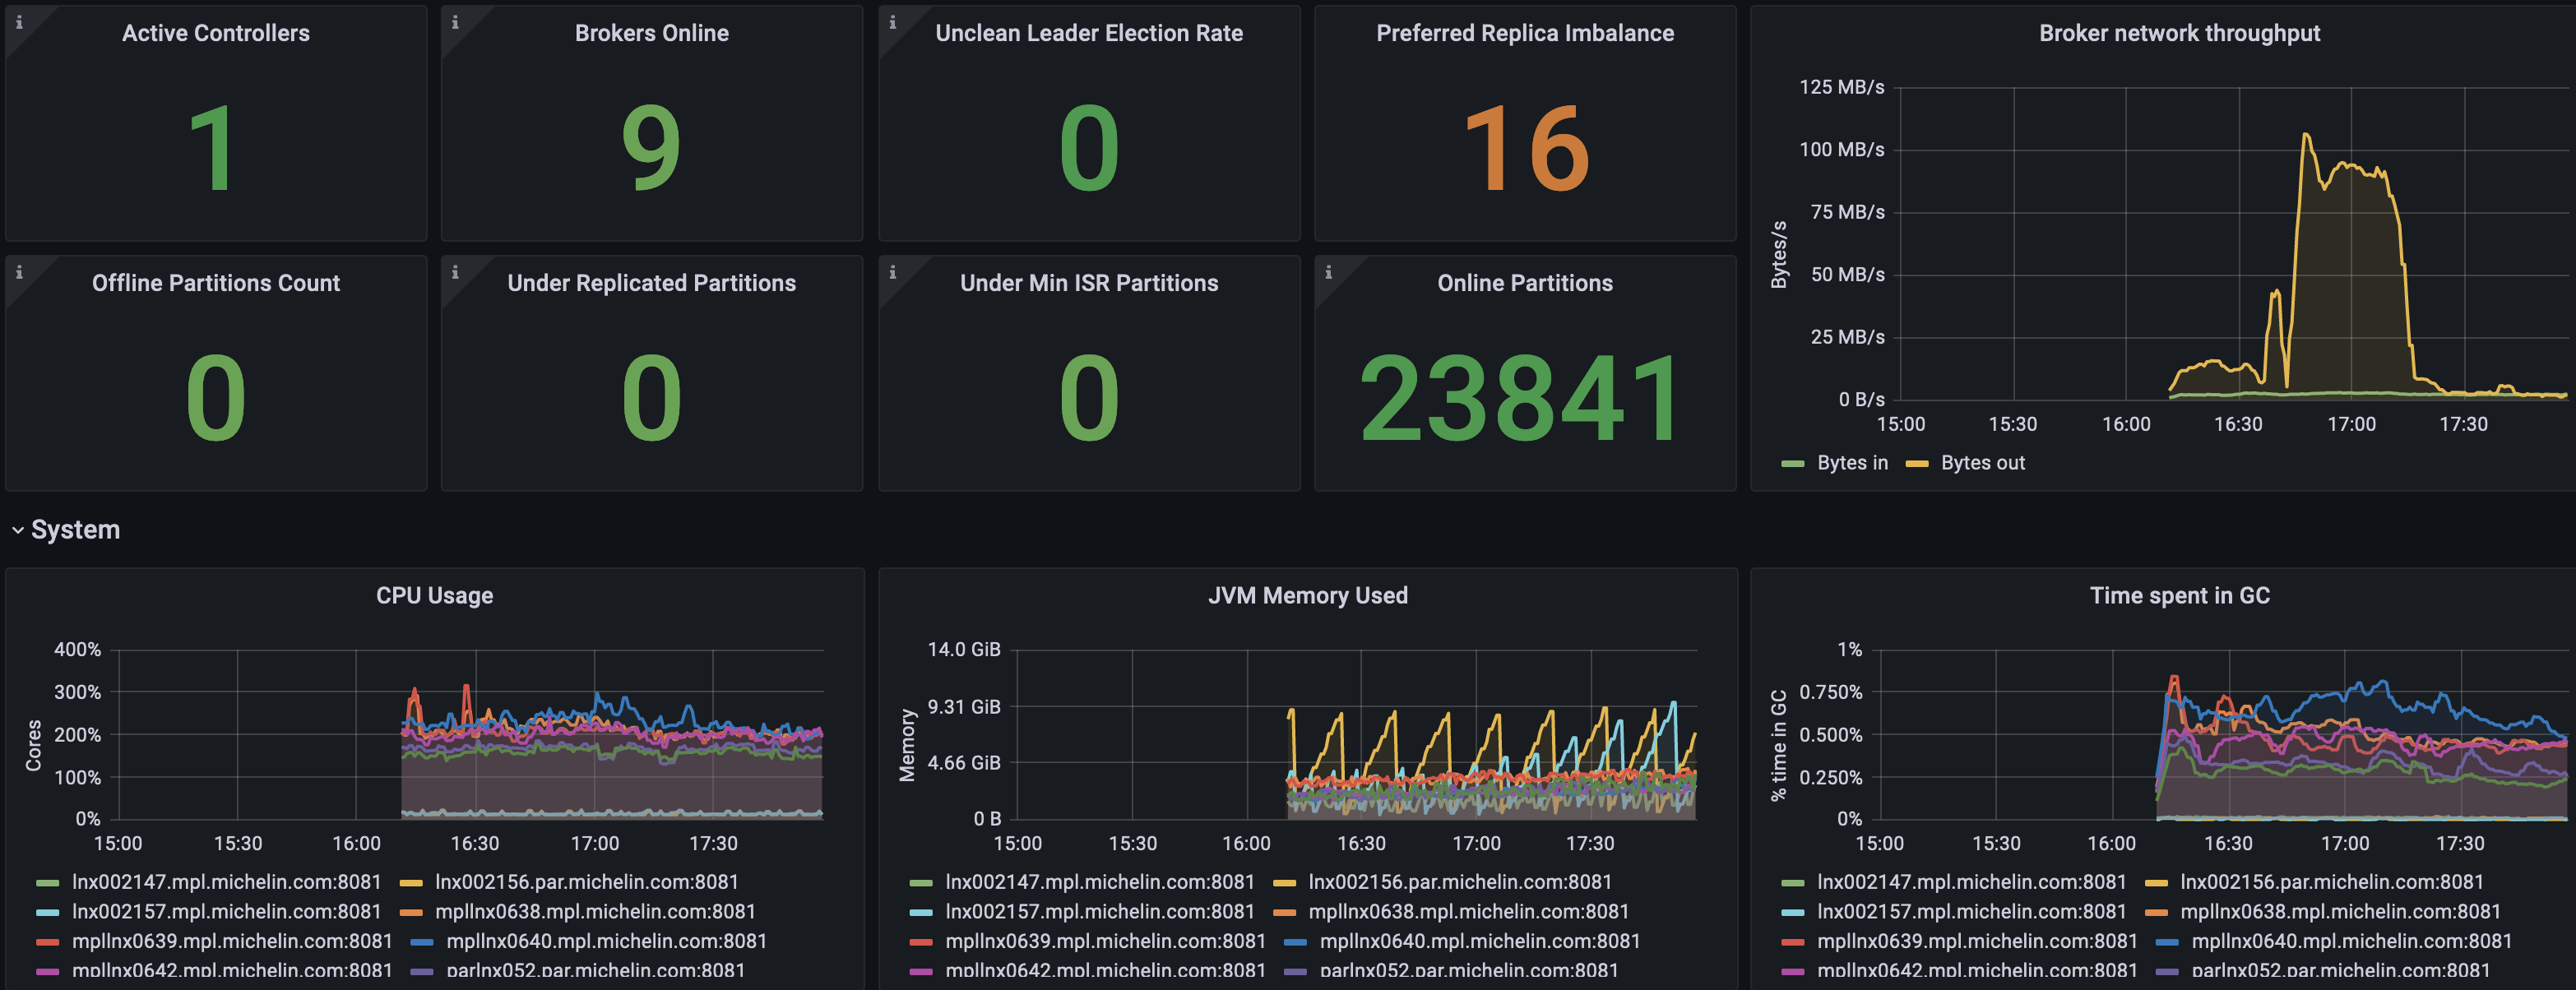
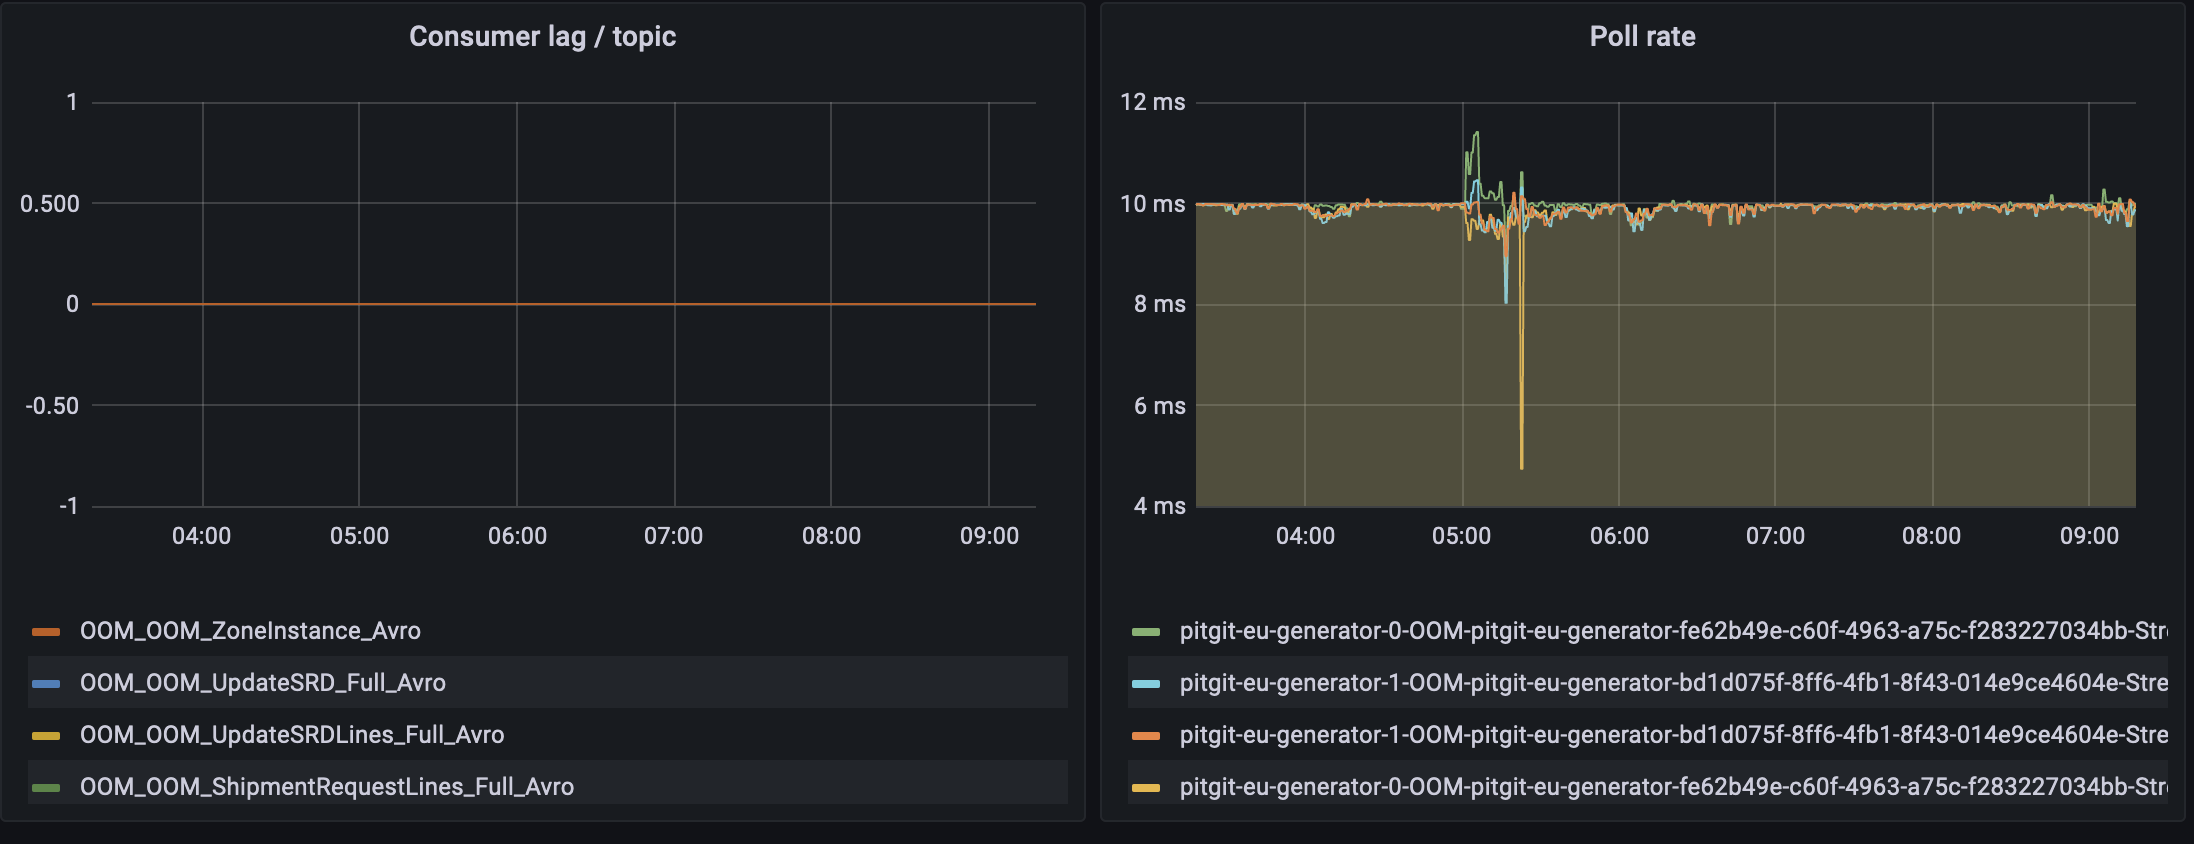
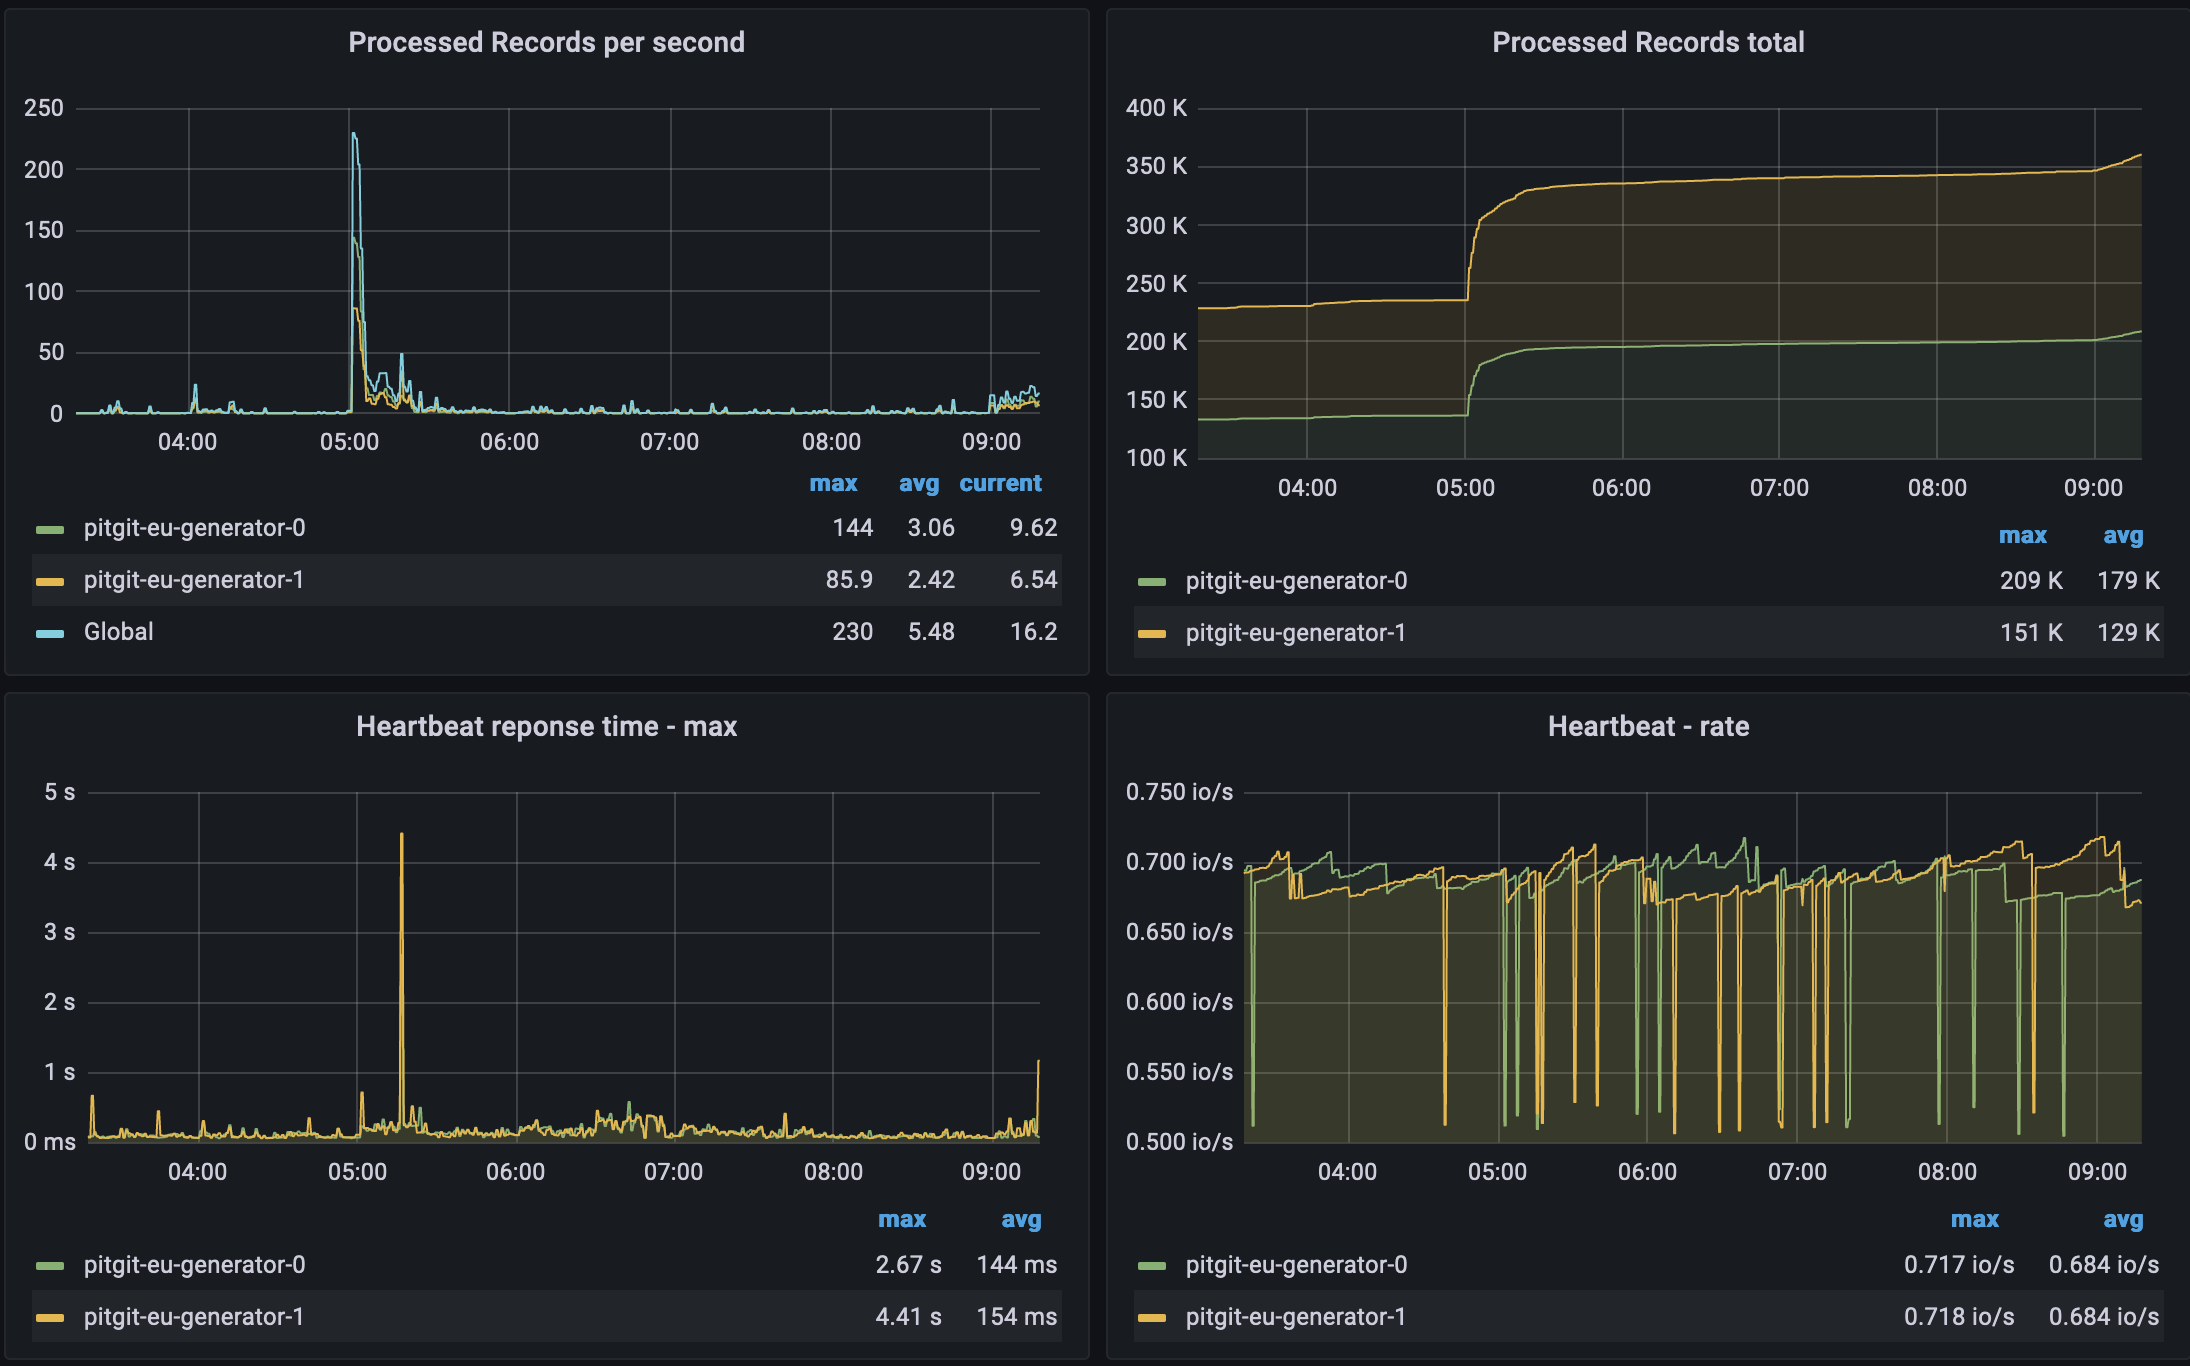
I have also uploaded some screenshots of this observability portal. The first one shows the health of our Kafka cluster with traditional metrics like active controllers, online brokers, number of offline partitions, under replicated partitions (that tells if we have communication issues between cluster nodes) and traditional CPU/Memory usages as well as the broker network throughput. The next two are focused on our Kafka stream microservices. We closely look at the consumer lag per topic as this one shows consumers that are having problems to consumer. In our case, microservices being behind to consume means we have a contention somewhere or even worse consumers down and our processes stuck. The last screenshot is more performance oriented with number of records processed per second and metrics on the heartbeat (response time & rate) which tells us if our micro services are healthy.
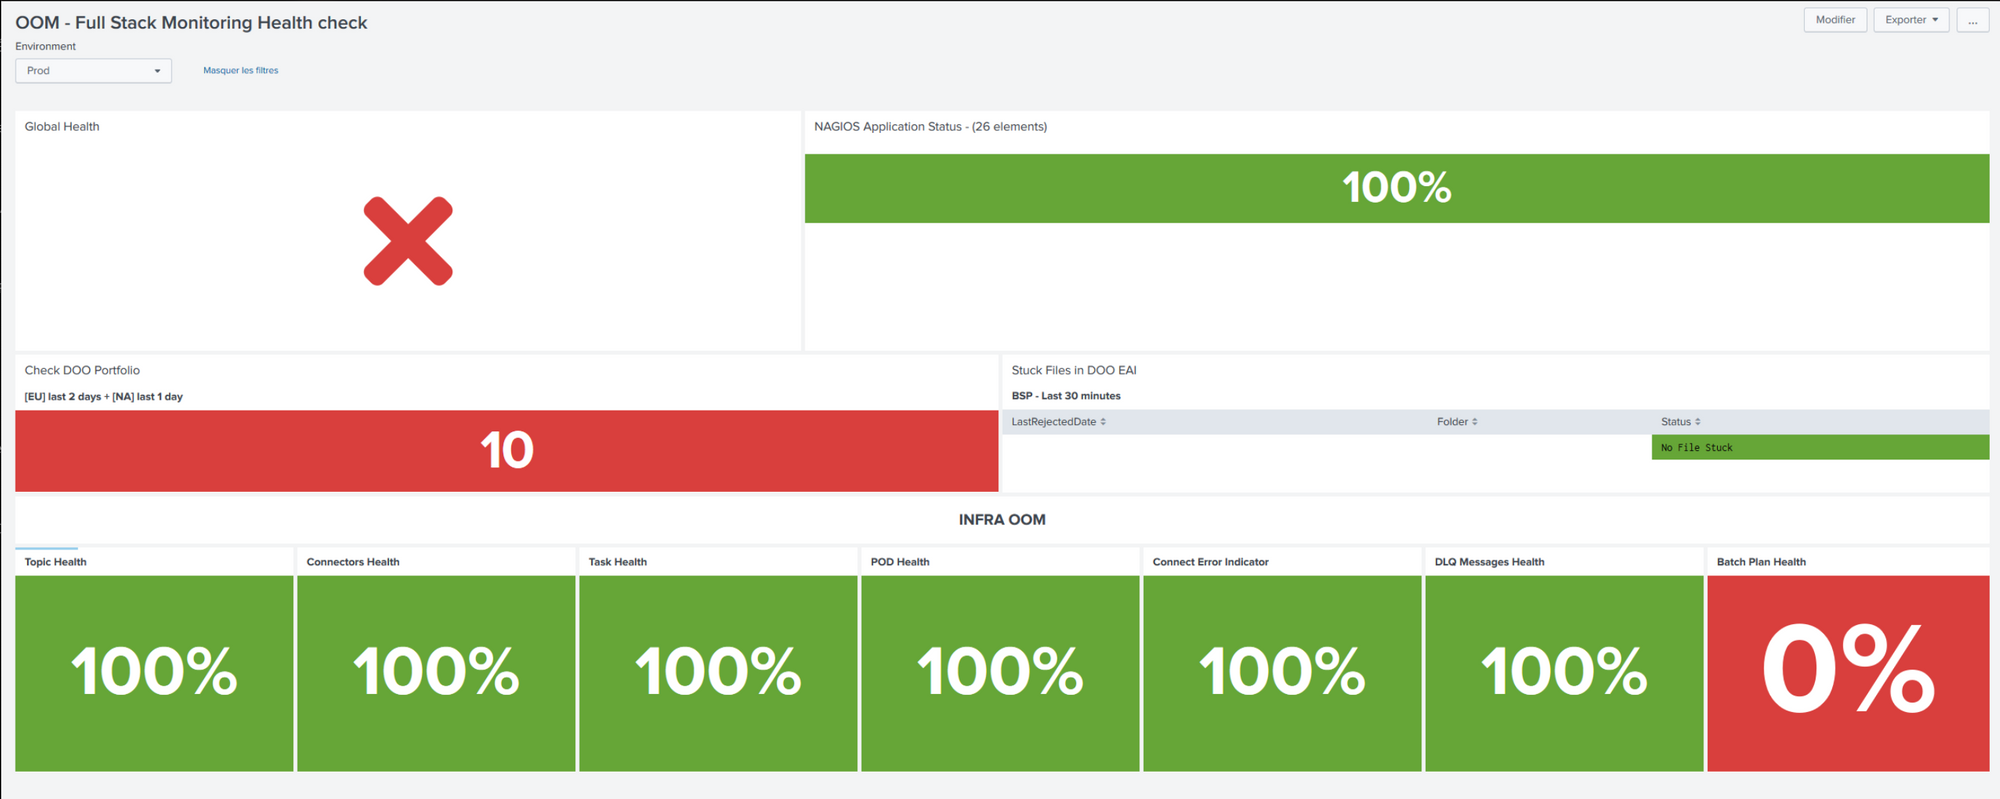
All of the above is designed to be used by technical people from the team. It does reflect the health of our Kafka ecosystem: from the broker, to connect and streams microservices. But it's not particularly helpfull to see how healthy our system is from a business standpoint. We came up with a more functional monitoring to help our support folks in their day to day activities. Here below is an example of our of their dashboard. As you'll see it's a mix of IS & IT view points. We added things like "order portfolio" that shows if the portfolio generation was ok for instance.
These dashboards are developed in Splunk, our log analysis platform and to enable this, we had to
- forward our micro services log files to Splunk
- connect our Kafka cluster to Splunk using a Kafka connect connector. Here we specifically created a bunch of Kafka topics containing denormalized messages easier to query in Splunk
- push Dead Letter Queues topics to Splunk too
A look back on the last 15 month
We could write a long article on what happened in the last 15 months but I prefer to give only one indicator to measure the success of this team. In a year or so, they were able to perform 25 production deployments with only 1 rollback and no business impact globally. Outstanding performance from our team don't you think? This team is performing extremely well if you ask me even if we can acknowledge that the roadmap we communicated early was mostly wrong. But I guess nothing new in the wonderful land of projects.
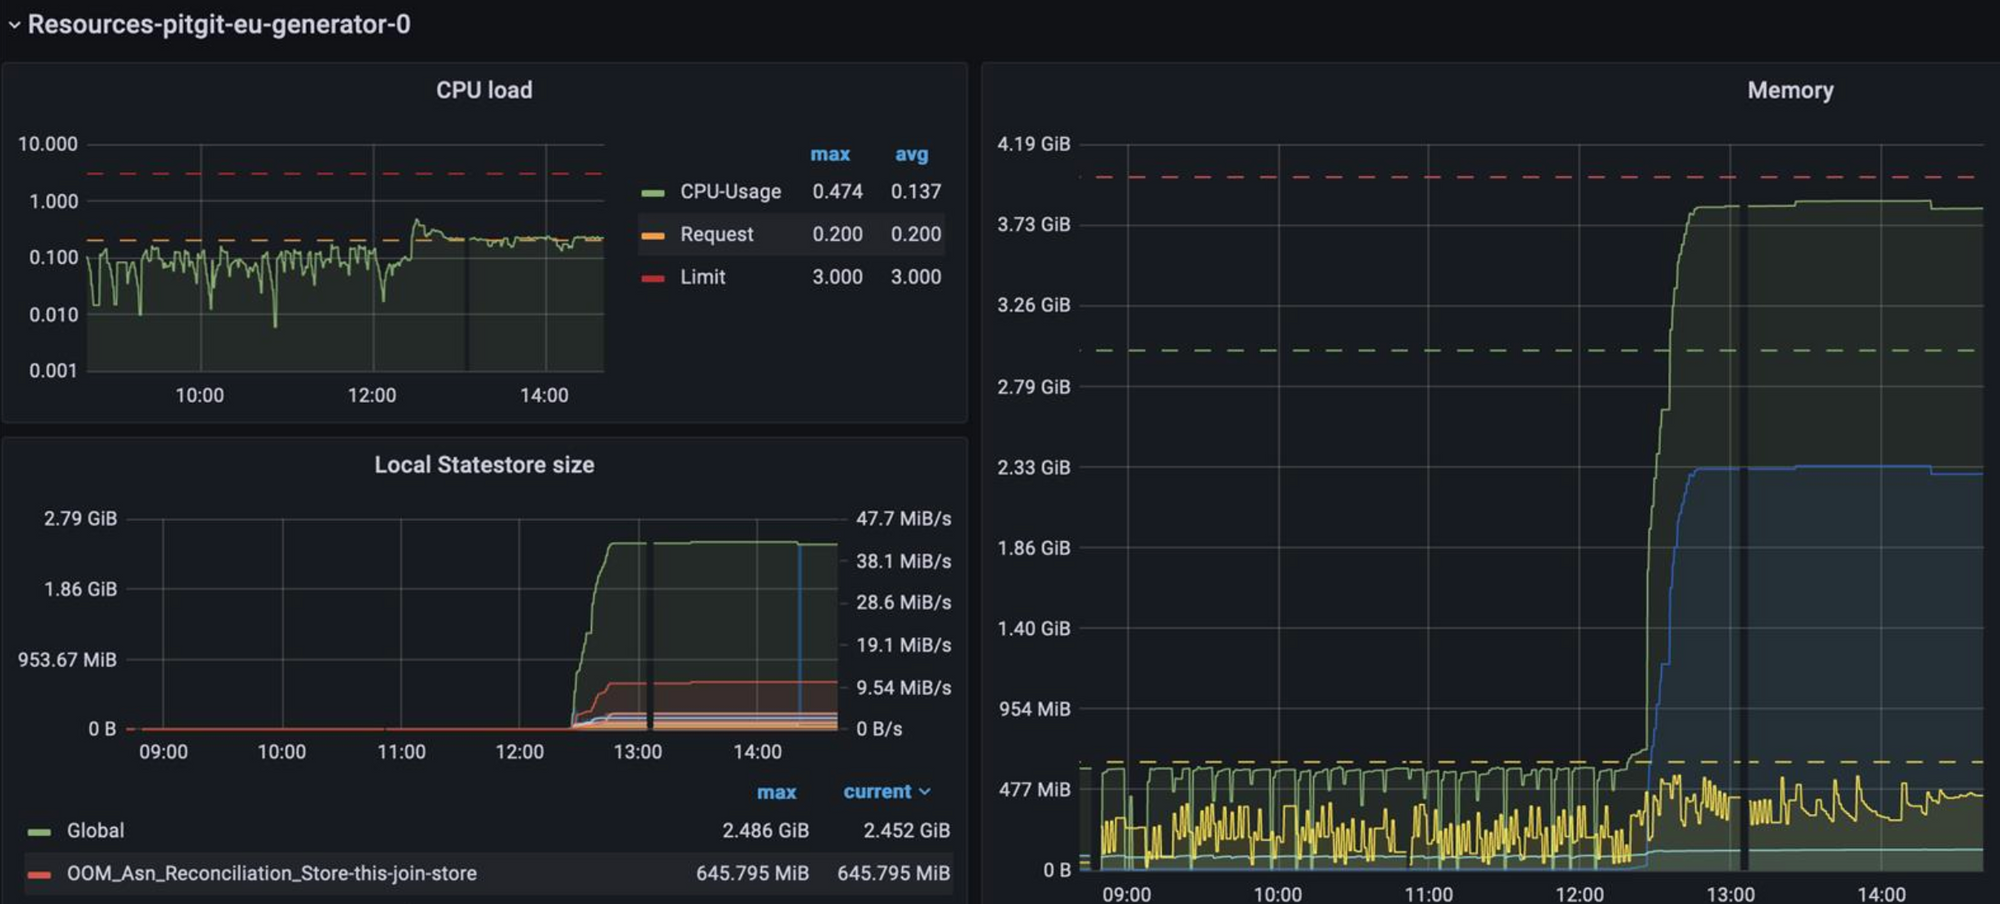
While I was writing this article, we had a severe network outage in our on premise data centers. Such an outage that our Kafka clusters hosted on 3 data centers were down for several hours. Obviously our microservices based choreography solution hosted on Microsoft Azure was impacted but it never collapsed and re-started almost automatically once brokers got back online. The team was able to survive such incident without loosing data and they delivered their SLO the night that follow. Long story short:
- Kafka can not survive to the loss of 2 from the 3 data centers it's hosted on but it can recover
- well developed micro-services can self-heal surprisingly well and process against events without much (if not none) human intervention.
On the below images, I guess you'll clearly see when our solution got back on line ;) It was waiting for better days.
In the next article
The next article will be last of this series and I'll write it with team members that made it possible. All together, we'll
- Go deeper in our technical solution around several use cases. How to correlate business events through Streams & Ktable joins? How to create a snapshot of our order portfolio in Kafka Streams without a data base?
- Share with you some of the technical challenges we've been through with some testimonials from the team. We'll try to give a realistic and fair feedback on Kafka Streams used for real in production.
- Explain our deployment & testing strategy and how Kafka was an enabler to support a continuous delivery.
Stay tuned ;)