
Service Level Observability


This post is based on our presentation for the Volcamp event in October 2022.
Observability is no more a matter of doing or not doing. It's an essential aspect of modern software development, providing all teams building services the data they need to understand the behavior and performance of their applications in real time. Observability has a broader scope than classical log-based Monitoring, it has 3 pillars: logs, metrics, and traces. The need for Observability comes from more complex systems, which are more and more distributed and more difficult to diagnose.
In this post, we will focus on the capture and analysis of Trace and especially around a famous standard called OpenTelemetry (that we will also call OTel to save space!) and its OTel collector component.
Disclaimer 🚨
We are not trying to sell the Observability tools we refer to in this presentation.
We are not experts on each tool that will be part of this blog post and will only scratch the surface of their capabilities.
Our goal is above all to promote Observability through OpenTelemetry and its vendor agnosticity.
Quality of Service @Michelin
At Michelin, the Quality of Service of our IT solutions is a top priority. We started a few years ago to implement a new organization to bring standardized and high-quality monitoring practices to our services. We have an internal Platform that is dedicated to supporting a global monitoring infrastructure for all the group needs, and this Platform is now evolving to support full-stack Observability solutions.
Michelin is also transforming its operations by introducing more and more Site Reliability Engineering (SRE) practices. Being able to precisely monitor the experience of the usage of our IT solutions with Service Level Indicators (SLI) is now a strong requirement for all our business-critical products.
Implementing complete end-to-end Observability is a complex task, for several reasons we detail below:
Capturing is complex:
- Classical monitoring constructed around logs is not adapted for distributed architectures and micro-services
- It is difficult to capture the actual quality of the user experience (Real User Monitoring)
- Logs, Metrics, and Traces have to be correlated with each other
Alerting is complex:
- False Positives, Alert Fatigue, and "Normal Errors" lead to alerts being ignored, and important problems hidden by a lot of noise
- Alerting on symptoms is more difficult than alerting on causes (but so much more useful!)
- From reactice to proactive: how can we alert on problems before they impact end-users
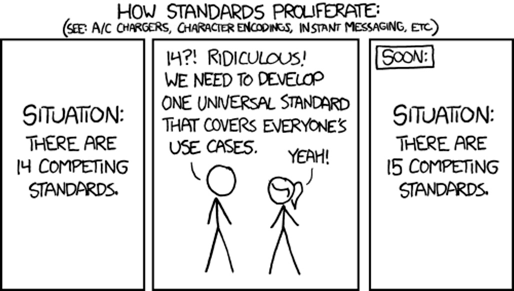
Huge market offer:
- Hard to choose
- Specific agents brought by each offer
- We are looking for agnosticism to avoid being coupled with a specific product
You said OpenTelemetry?
OpenTelemetry is a merge of two projects OpenCensus and OpenTracing. It is a set of open-source standards around APIs and SDKs to capture and publish metrics, traces, and logs from applications.
You said standards?
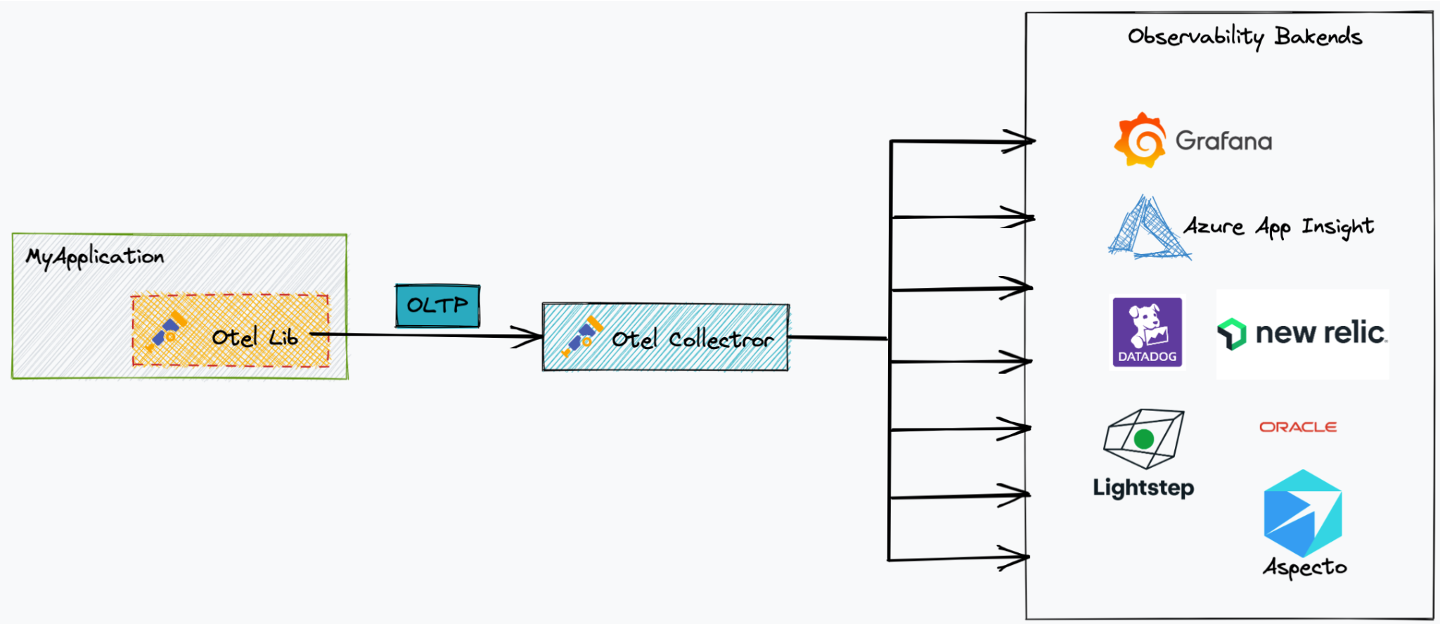
It's "just" one of the elements from a complete chain of observability. OTel does not contain any backend to store what you publish, nor a way to visualize this data, nor a way to alert on this data.
There are several companies that are contributing to the OTel projects and implementing it natively in their offers and frameworks.
Instrumentation
In order to produce metrics and traces, the code of an application has to be instrumented. There are basically two ways to instrument application code:
- Manually: you can use OTel APIs directly in your code to publish the value of a metric or start a new trace
- Automatically: here OTel will directly intercept method calls in your application to identify your usage of commonly recognized APIs and Frameworks (Database accesses, HTTP requests, interactions with Kafka, messaging, ...)
Auto-Instrumenting an existing application with OpenTelemetry is quite easy at the first glance and enough to start seeing very interesting data. The actual way to instrument an existing application depends on its language:
-
Java: an agent that allows you as well to instrument closed-source applications.
java -javaagent:path/to/opentelemetry-javaagent.jar -jar - myapp.jar -
NodeJS: bootstrap the startup script
node --require './tracing.js' myapp.js -
Python: use of a wrapper to run your app
opentelemetry-instrument --traces_exporterconsole python myapp.py
OTel supports other languages as well.
Demo application
OpenTelemetry is a complete ecosystem that also directly includes a demo application that lets you test the frameworks and evaluate different observability backends.
The demo application is a simple micro-services eCommerce website. Its micro-services are implemented in different languages and use different approaches for instrumentation.
The demo application even comes with a ready-to-use Locust installation to inject synthetic load. Locust is a popular Python based load testing tool.
Our goal was to validate the assumption that even if you don't know how an application has been designed and how application services are interacting between them, you can dig inside application behavior.
Here below are the results right after starting the instrumentation of the demo application.
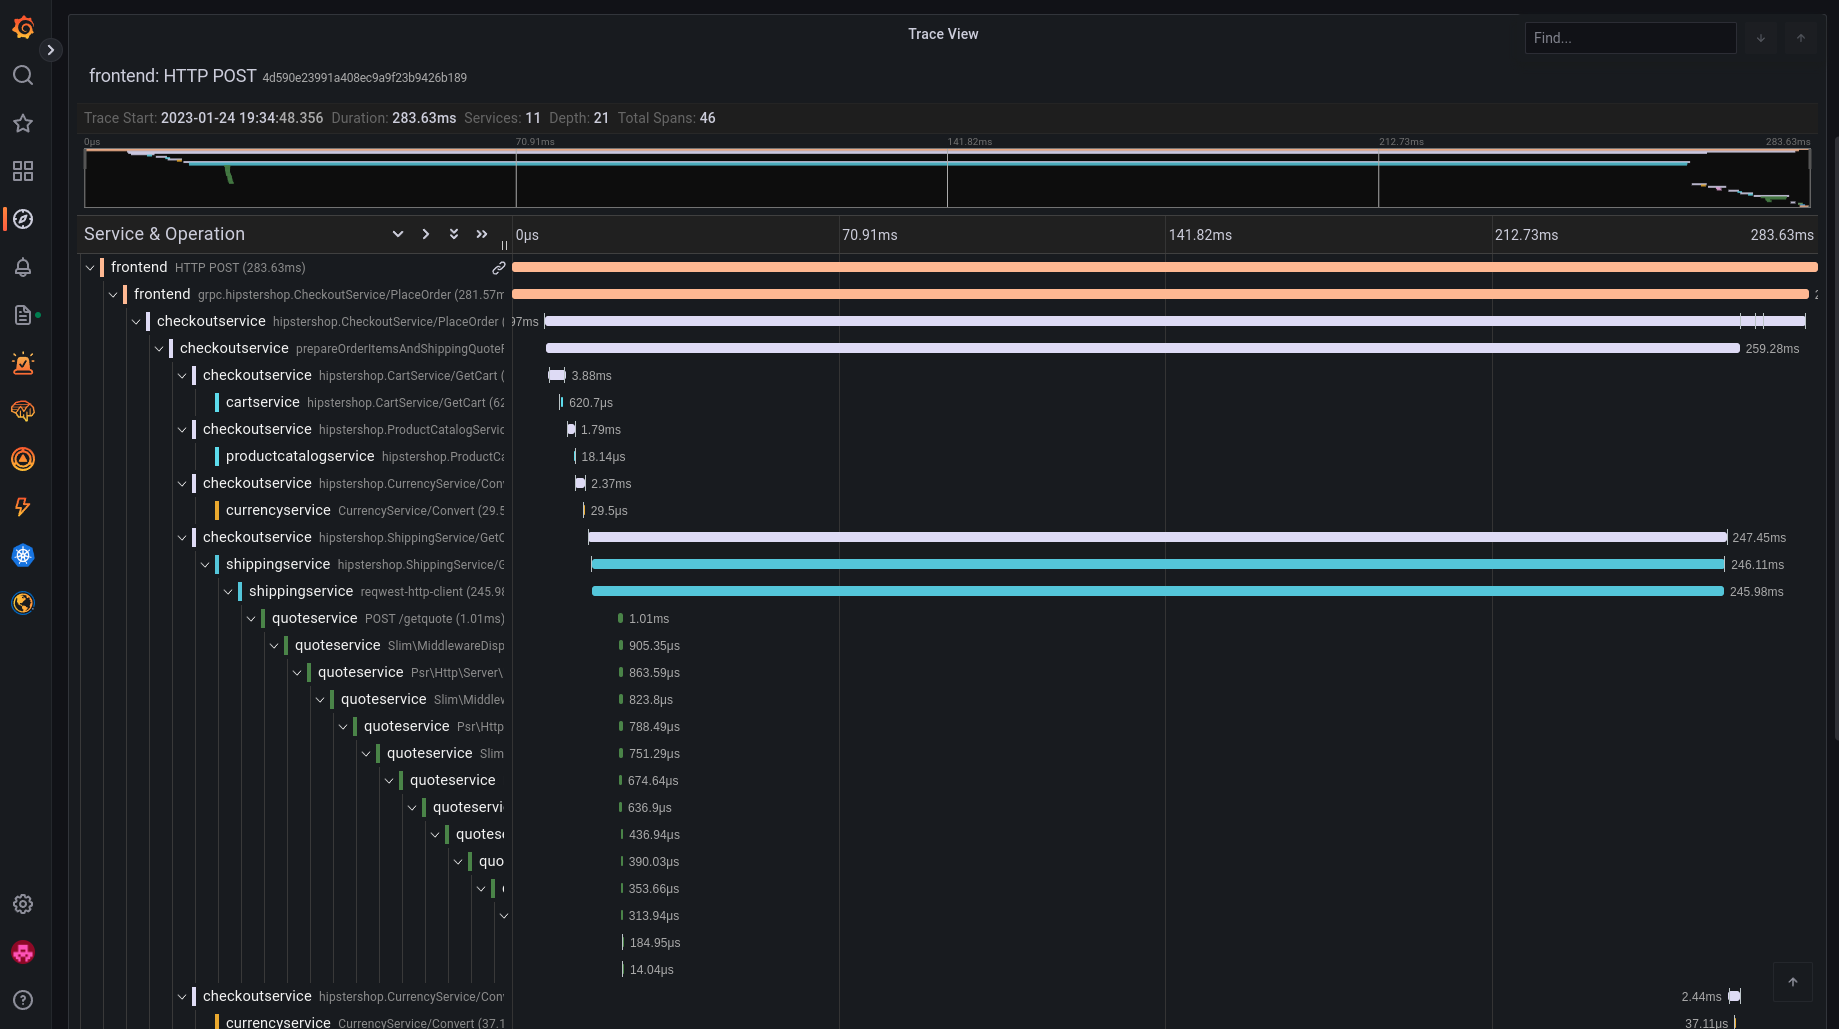
This is what a Trace looks like, it is made of a hierarchy of Spans which all have attributes that have either been automatically captured by OTel or manually added by the developer. The shape of a Trace gives interesting insights in the internals of the application: even without the code, you can identify possible problems (wrongly implemented retries, missing parallelism and performance bottlenecks).
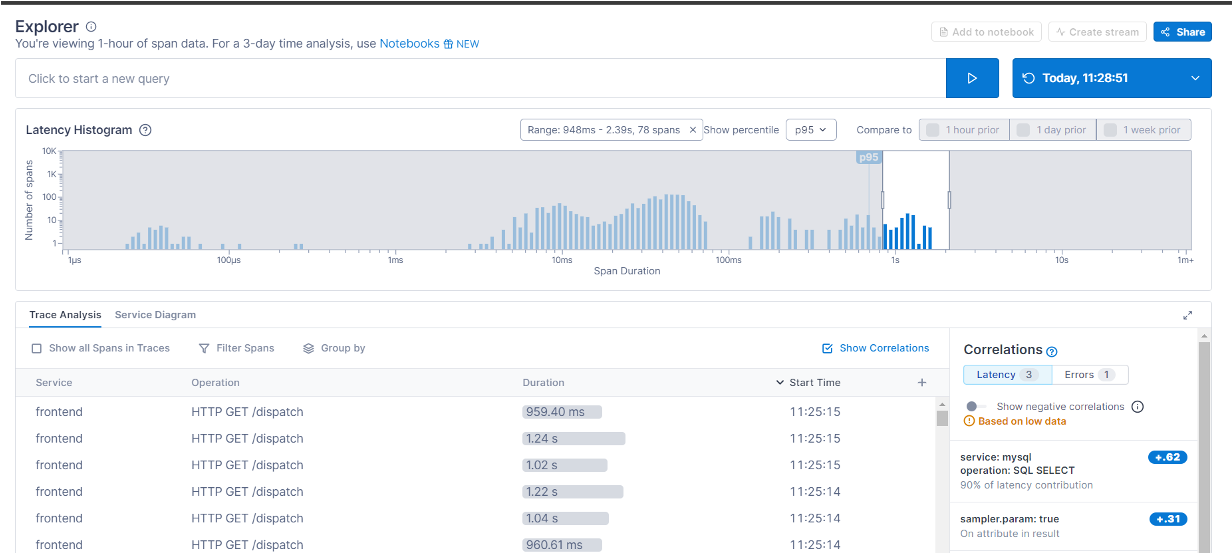
Using another tool: Datadog, with the same data, you can obtain this kind of view natively:
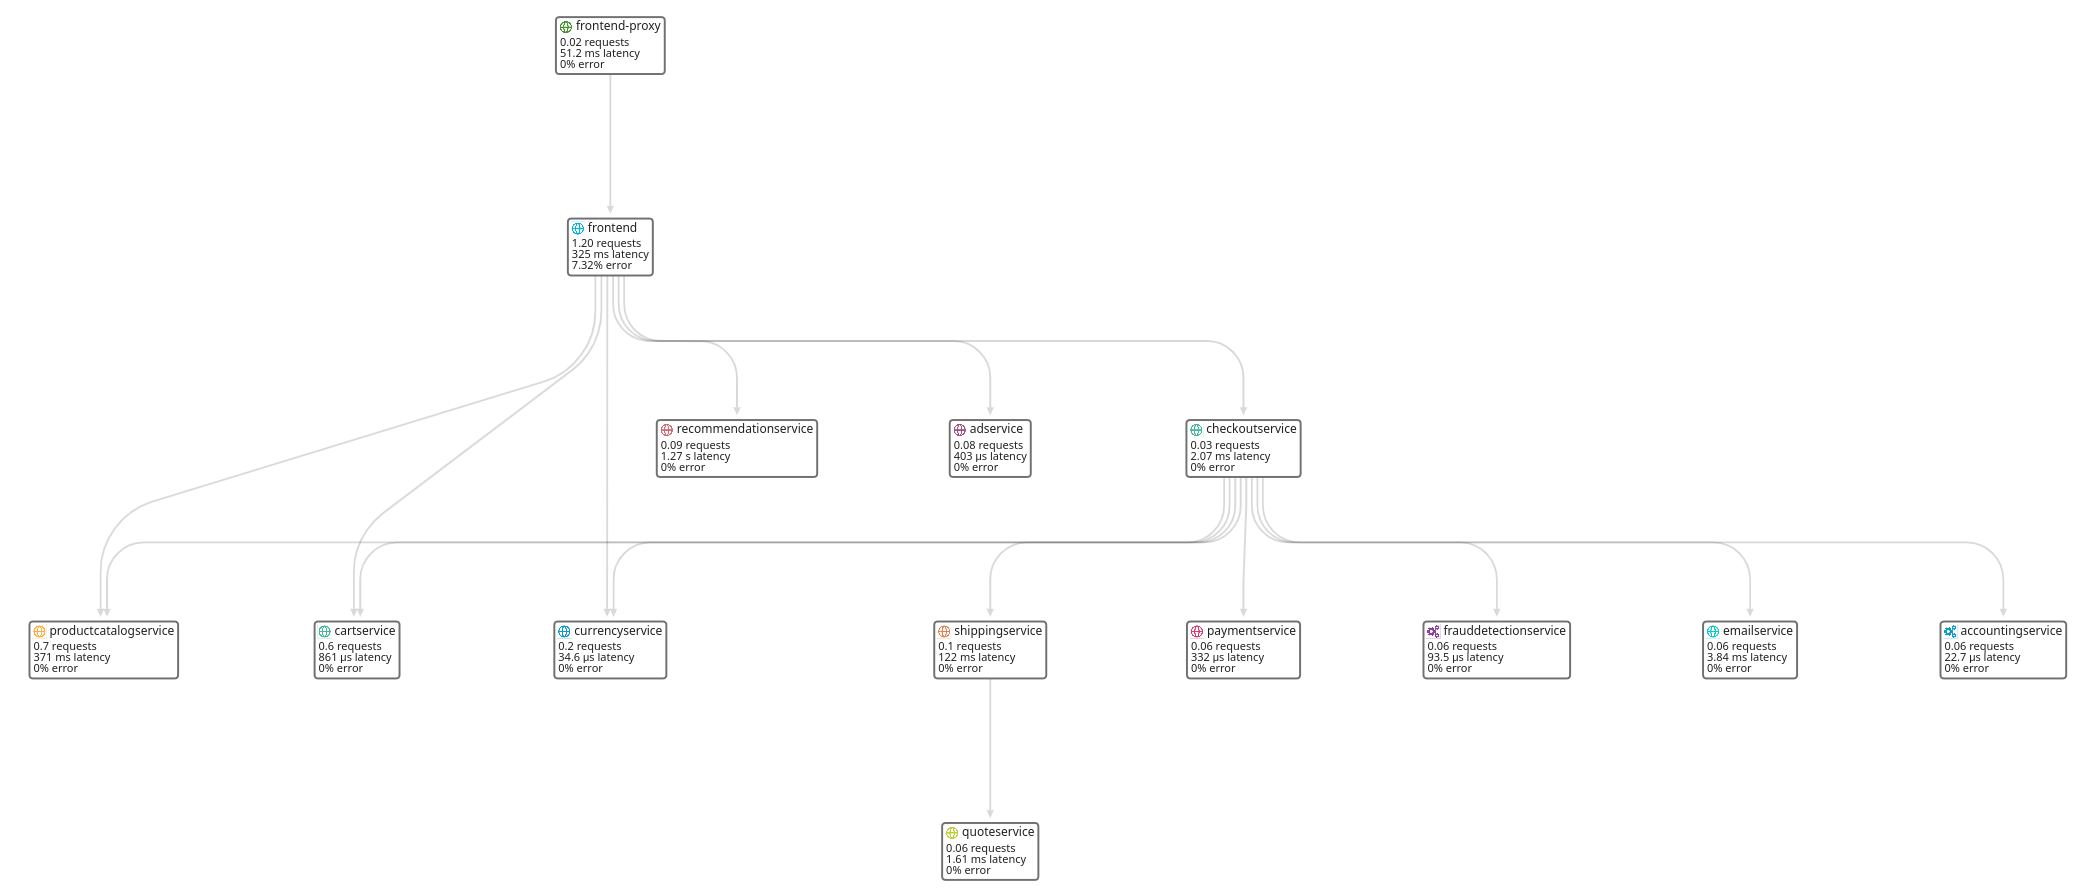
This is a live visualization of exchanges between different application services. You can use it to visualize quickly and identify bottlenecks and understand application architecture.
Last but not least, using Lightstep, yet another tool that supports OTel data ingestion:
You can rapidly identify the slowest traces by selecting them and see that are the SQL statements that are taking almost all the time. Remember, you don't have the code but you can still dig deep inside the application behavior !
Ok but what about OTel Collector?
We have seen that is it very easy to implement Opetelemetry on an application. As said before, @Michelin we had to deal with the fact that we are in a huge organization with developers, SREs, and support teams doing monitoring for a while. This means we have to deal with several different tools to collect, store and visualize metrics and logs.
This is where OTel Collector is a game changer.
OTel Collector is located between your application and the Observability backends.
You describe pipelines in the collector that are made of 3 parts: receivers, processors, and exporters.
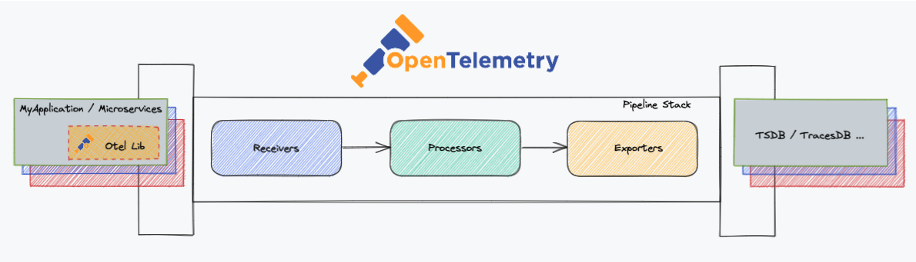
A key feature of the collector is the implementation of these smart pipelines, OTel comes with standard processors that let you do a lot of different things:
- Batch data before sending them to the backend
- Sampling data (reduce the amount of data sent on the network and stored in the backend)
- Anonymize data (replace sensitive information like emails with hashes, for instance)
- Remove sensitive data
- Transform, enrich, and contextualize data (K8S node info, specific attributes provided by cloud providers ...)
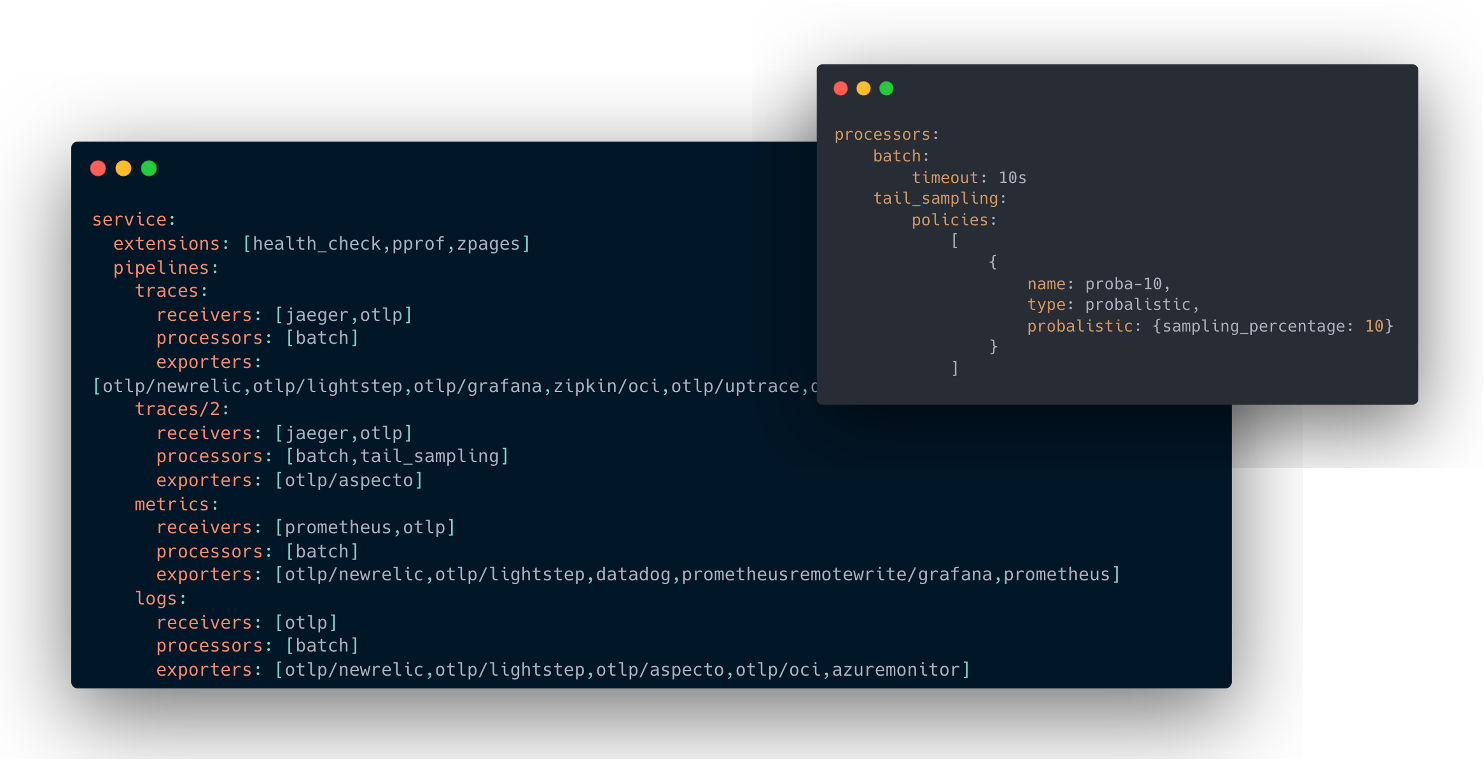
You can, as well, enable or disable backends as needed.
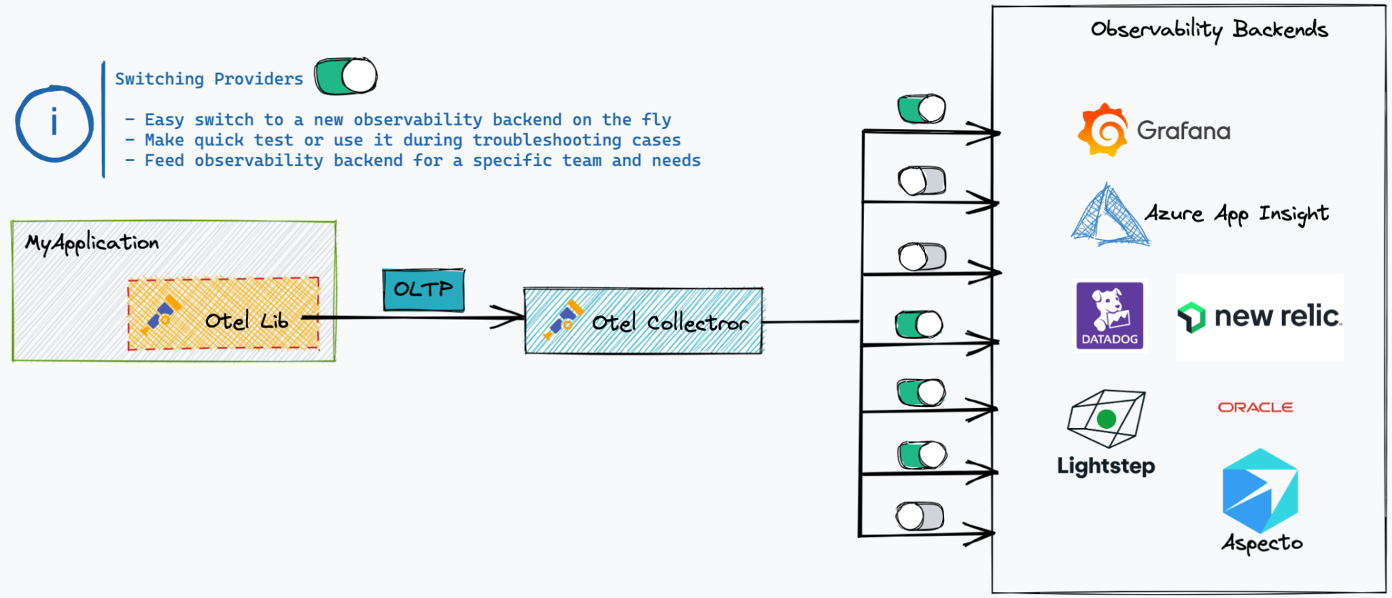
And of course, you can have specific pipelines for specific backends, so you can easily decide with sampling to only send 10% of your traces to a specific vendor for example, or to anonymize all logs sent to another one.
What's coming with the OTel Project?
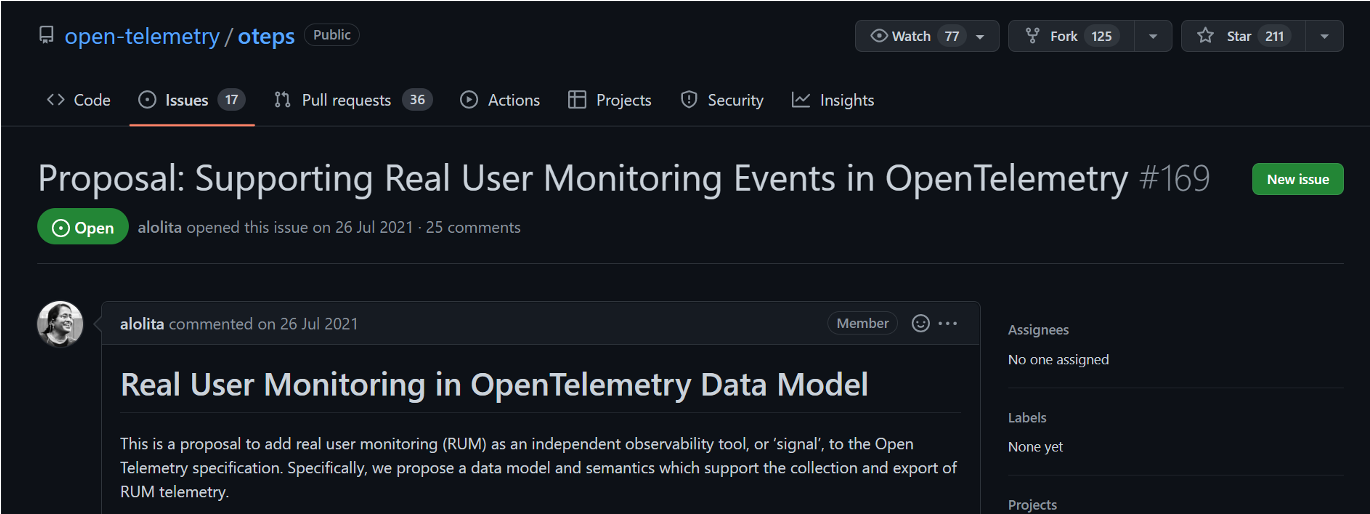
Today it's hard to implement completely end-to-end Observability because of the lack of Real User Monitoring (RUM) in the OTel standard. You can capture what is happening on the backends, but all the activity is completely executed on the actual device of the user is not captured.
This gap has been identified for a while now by the OTel team. There is a now very mature proposal described on the project Github that explains what is missing in OTel and what is the plan going forward to implement complete RUM directly in the standard.
Another initiative we are following closely is around the work done jointly with eBPF to capture low-level Linux kernel events (I/O, Network ...) with very low overhead on the system performances. The existing eBPF / OpenTelemetry topic is somewhat experimental for now, but for sure we keep an eye on it, as eBPF is a very promising technology with tremendous potential in the Observability space.
To conclude...
OpenTelemetry is clearly a key player in the Observability area. Let's go back to our initial problem statement to see how OTel can help us overcomes the 3 challenges we mentioned.
Capturing is complex:
- Auto instrumenting an existing app is a breeze if it's written in one of the supported languages, and the provided APIs are very simple to use
- Real User Monitoring is still a challenge but a solution is hopefully coming directly in OTel
Alerting is complex:
- Traces make alerting on symptoms simpler, it becomes easy for example to alert on the performance degradation of specific spans (which happens to be on your critical user journeys)
Huge market offer:
- Being product agnostic, OTel will help you avoid being coupled with a specific offer, and makes a switch easy
We hope this blog post helps you with an overview of OTel capabilities. At Michelin, we are definitely convinced it has a lot of potential!
Feel free to contact us to discuss this!
If you are interested, the video of our talk (in French) at Volcamp is available online.
This article is part of an ongoing series we plan to do on Observability in this blog. Keep connected !