
Our Monitoring Journey in North America - Part 1


The purpose of this post is to highlight monitoring in Michelin North America; not just the tools and technologies available, but also the different kinds of monitoring, available tools, and our evolving process to add value through these activities.
The Problem
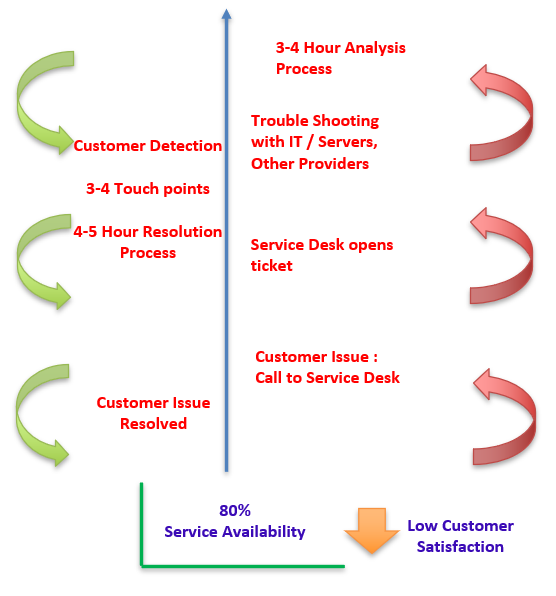
Michelin instituted a control tower a few years ago. It was created as a system of measurement and accountability between the business and the IT department. Services and the amount of time available were assigned points based on their criticality to business functionality and the IT department was graded each day. A day in which services were adequate to ensure business operation was deemed a green day and a day these services were not adequate became known as a red day. This system quickly revealed room for improvement - January and February of 2018 combined for only 80% green days. Previous years were even lower. Problems needed to be caught and corrected more quickly. Below is a depiction of Michelin NA's IT support process at the beginning of 2018:
Target and Approach
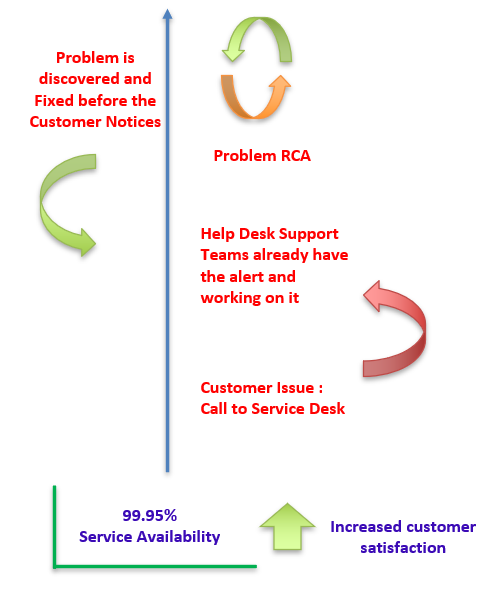
A steering committee created a set of priorities for the year - focusing on data flows rather than applications - that needed monitoring. 12 external customer facing flows were identified as the main priority. Below is a snapshot of the target support approach:
A cross-functional team was formed with the task of monitoring these critical external customer facing flows. This team would work with support and DevOps staff tied to each of the flows. Together, this group would complete a series of tasks:
- identify pain points
- gather monitoring requirements
- create dashboards and alerts for problems in the data flow
- make a robust runbook which would identify specific actions to take when certain issues occurred
- monitoring would then undergo testing and the support teams would engage in knowledge transfer for full understanding and support of the new monitoring
- After IT and business approval, the support staff and DevOps would assume responsibility of the usage and maintenance of the monitoring solution
The 12 flows would be split out amongst monitoring team members, with each being a lead and point of contact for the individual flow.
Tools
Our monitoring catalog consisted of three tools for use in these flows. First was Nagios XI. Nagios is an open source tool used primarily for monitoring server infrastructure metrics such as processor load, memory usage and disk utilization.
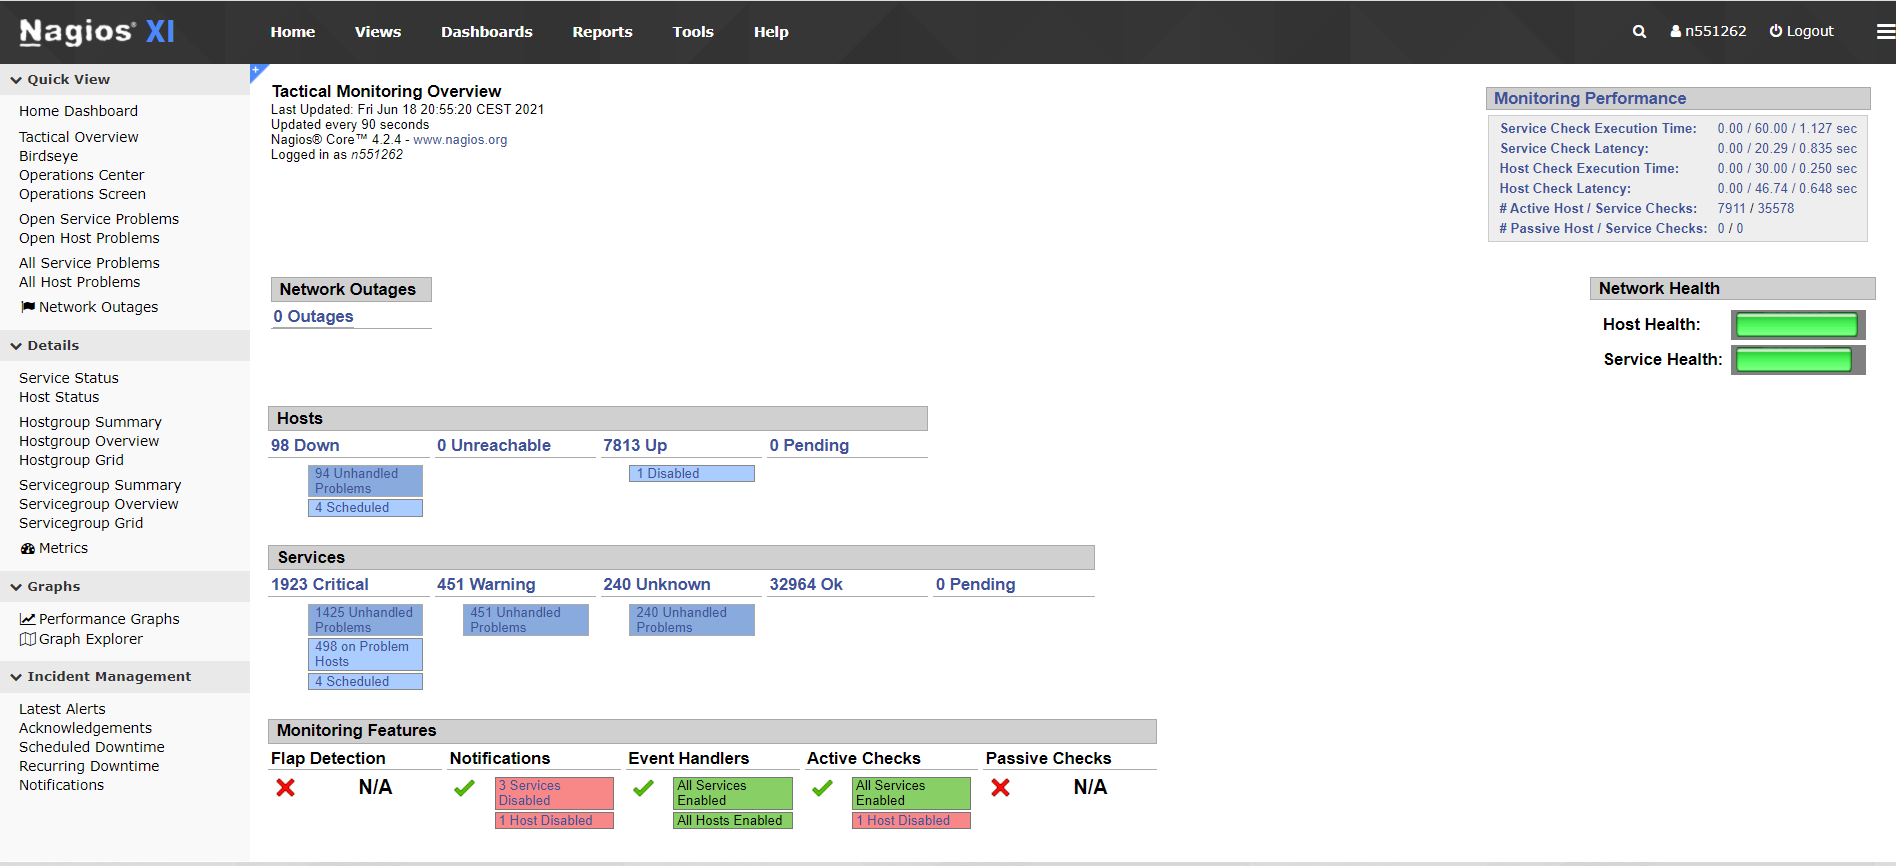
This agent would be installed on all the applicable servers involved in the 12 flows, and would report back to a central Nagios collector server. This server stored these metrics and displayed some basic dashboard displays for this data, but also featured some basic alerting capabilities via email. This agent was configured to alert the respective support teams for each server if CPU or memory went above pre-defined thresholds, which could be adjusted as applicable.
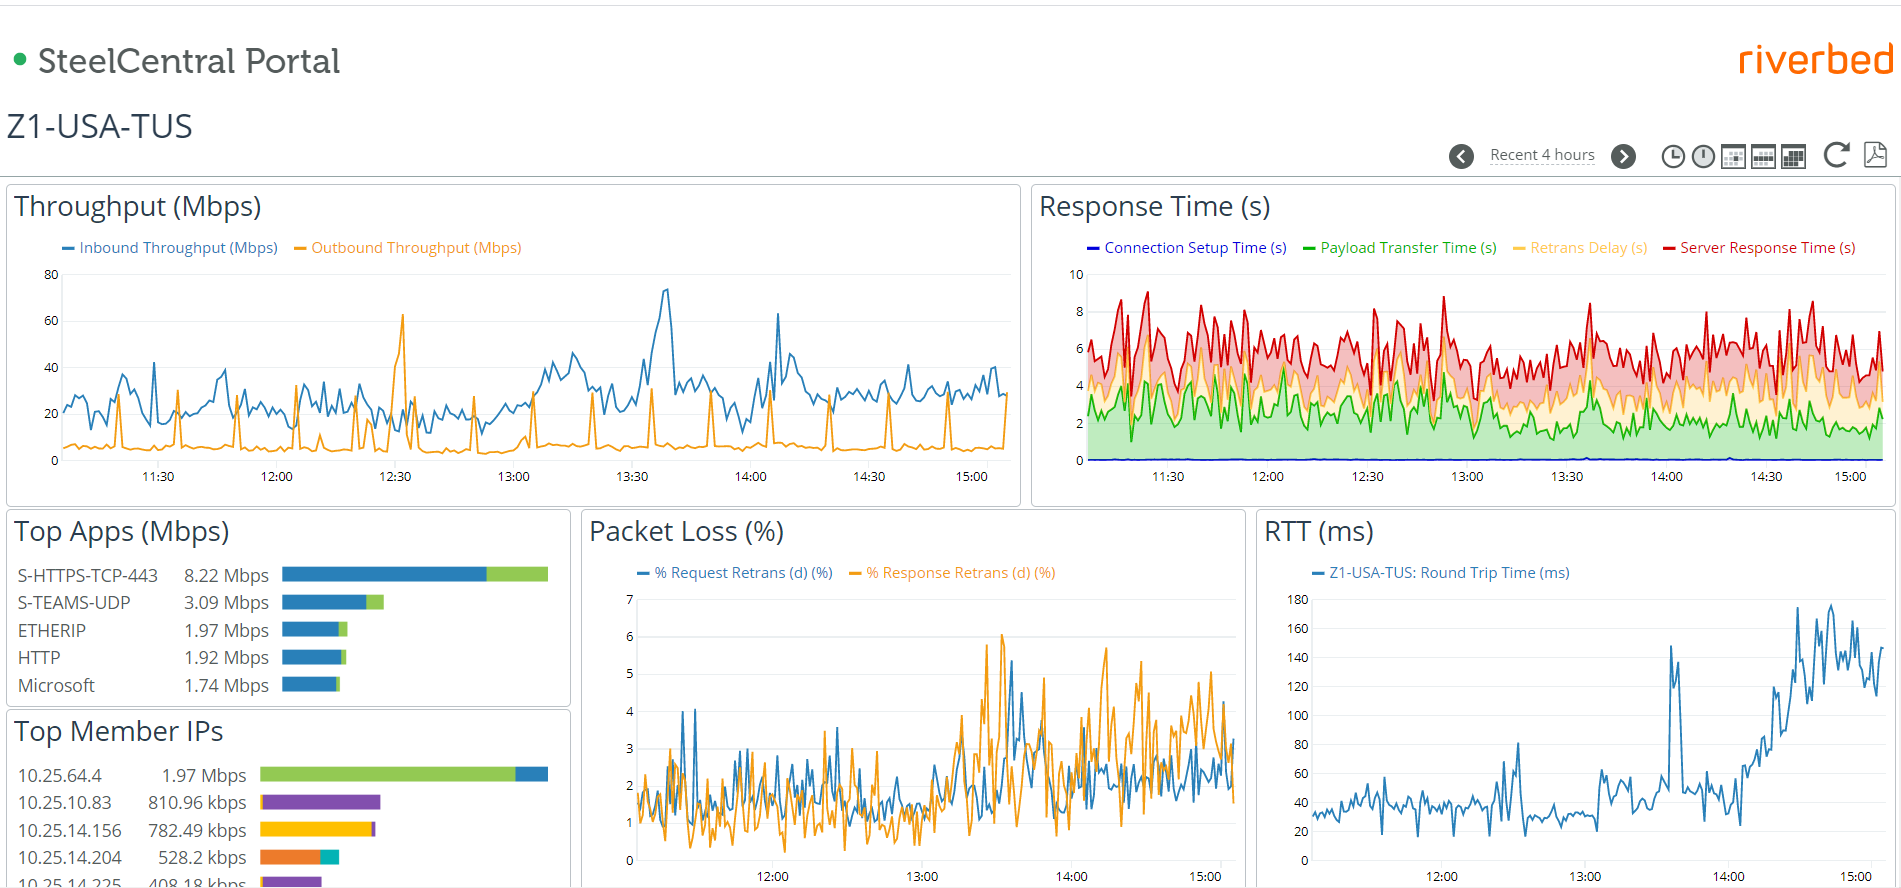
Our next tool was Riverbed, in particular their SteelCentral module. Riverbed - SteelCentral was used for our network monitoring. It works via installation of probes, which can be either virtual or physical, within Michelin's data centers. Once installed, these probes can monitoring various network statistics, including dropped packets, sources and destinations, protocols used, bandwidth and latency. These probes were installed strategically within data centers in North America and Europe to appropriately monitor the internal health of our network.
The third tool, which was our most critical to implement but also most challenging, was Splunk. Splunk is not a monitoring tool, rather it is a data aggregation tool which features monitoring capabilities, including alerting and dashboarding. It also interfaced with other tools and accepted data from multiple sources, creating the potential to become a central location for monitoring analysis and correlation.
Splunk featured an agent that could be installed on Unix, Linux and Windows servers to pull in log files as events. It also had a plethora of plugins available for other data sources, such as Oracle database connections, monitoring of MQ queues, connectivity to APIs, and more. Splunk also functioned as our "central pane of glass"; we moved all the data that we could from other tools into Splunk.
Challenges
All of the data flows we were tasked with monitoring consisted mostly of legacy systems. This was one of the primary reasons reliability issues occurred in the first place. This immediately introduced limitations and incompatibilities with some of our monitoring tools. Many were not using standard solutions throughout - one leg of the flow could have multiple file transfers through Axway Managed File Transfer, our existing standard for secure file transfers, and another leg of the same flow could simply use FTP. Below is an example of one of our problematic data flows, with application names removed for confidentiality.
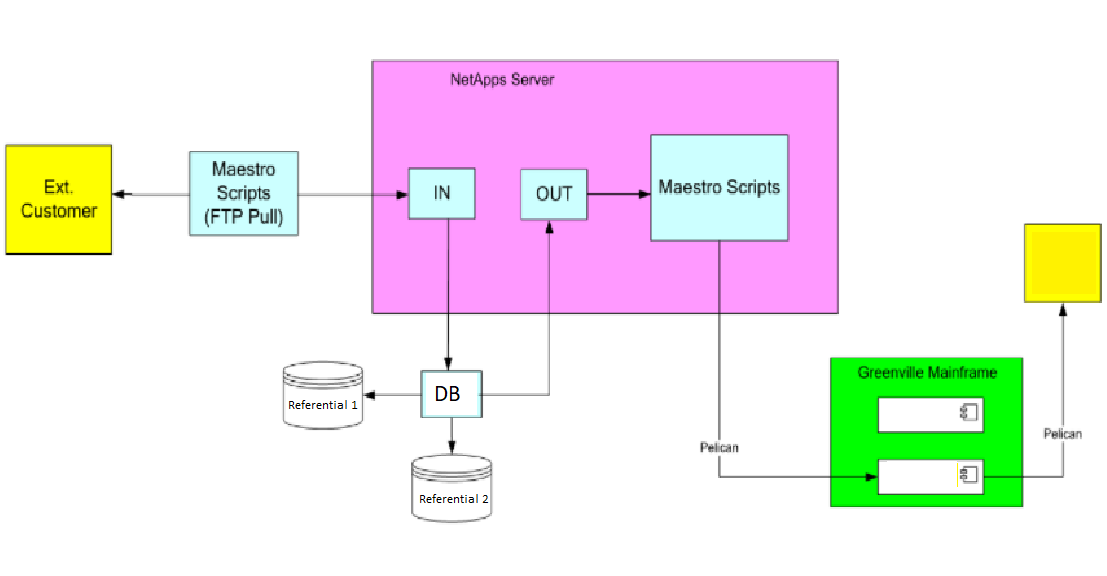
Files were pulled in to a NetApps datastore on regular intervals via a scheduled FTP job from our external customers. These files were then separated and processed through an inventory tracking database via Axway file transfer jobs. This database fed two referential systems, underwent some data cleaning and editing, and was then transferred via Axway file transfer to a separate application on our mainframe. The mainframe then fed a third referential system for the final segment of the flow. Parts of this flow were run by Tivoli Workload Scheduler, and other parts were not.
Most of these flows (the one above included) were batch oriented; if a job failed, it would create a cascade of failures that could not be remedied without intervention from multiple teams.
We initially thought known pain points and documented issues would be an advantage in this project, but that turned out not to be the case. Most documented issues were the negative end result and not a diagnosed root cause (i.e. a customer calls and informs Michelin their order was not processed as expected, which could potentially be caused by failures in 7 or more systems upstream). Furthermore, our support teams were very siloed in their responsibilities. One team would be responsible for a specific application, another for a specific middleware technology, neither necessarily having transverse knowledge of what happened to data once it left their respective systems of responsibility.
Implementation
The monitoring team elected to take a "divide and conquer" approach. One member of the monitoring team would be assigned as the lead and point of contact for each of the data flows. This person would be responsible for gathering requirements for the applicable flow, learning about what the flow did and what systems it ran on, meeting with the support and DevOps resources responsible for any of the legs of the flow, and ultimately delivering the technical monitoring solution for that flow. This usually consisted primarily of alerts which notified the support team of a failure that required action, and dashboards which allowed visual representation and analysis of different parts of the data flow for a potentially broader audience.
This first involved itemizing all the systems in the data flows and installing Splunk and Nagios where possible. If neither were compatible, the monitoring team would determine another way to transfer pertinent information into Splunk if possible. If not, the monitoring team would relay the risk from lack of information to the steering committee and support teams.
The analysis phase was next, which sometimes involved completely reverse-engineering the flow to truly understand how it worked, utilizing the assistance of subject matter experts and developers to help identify and mitigate risks from potential gaps in support's siloed responsibilities.
The monitoring team met for daily standup meetings each morning. Any blockers on an individual's flow would be raised, and those items could be escalated up the management chain if necessary. It also allowed transparent knowledge sharing; team members were regularly able to help each other when someone was stuck or out of workload capacity.
The support teams were responsible for learning about the monitoring being implemented and creating a runbook, which detailed specific mitigation actions for the team to take once an alert was triggered. They also ultimately owned the monitoring solution; once development was finished, a signoff occurred. Upon agreed completion of the monitoring solution, the applicable support squads signed an official document reflecting the monitoring was in production, it was understood by the team, and they assumed responsibility for usage and maintenance of it moving forward.
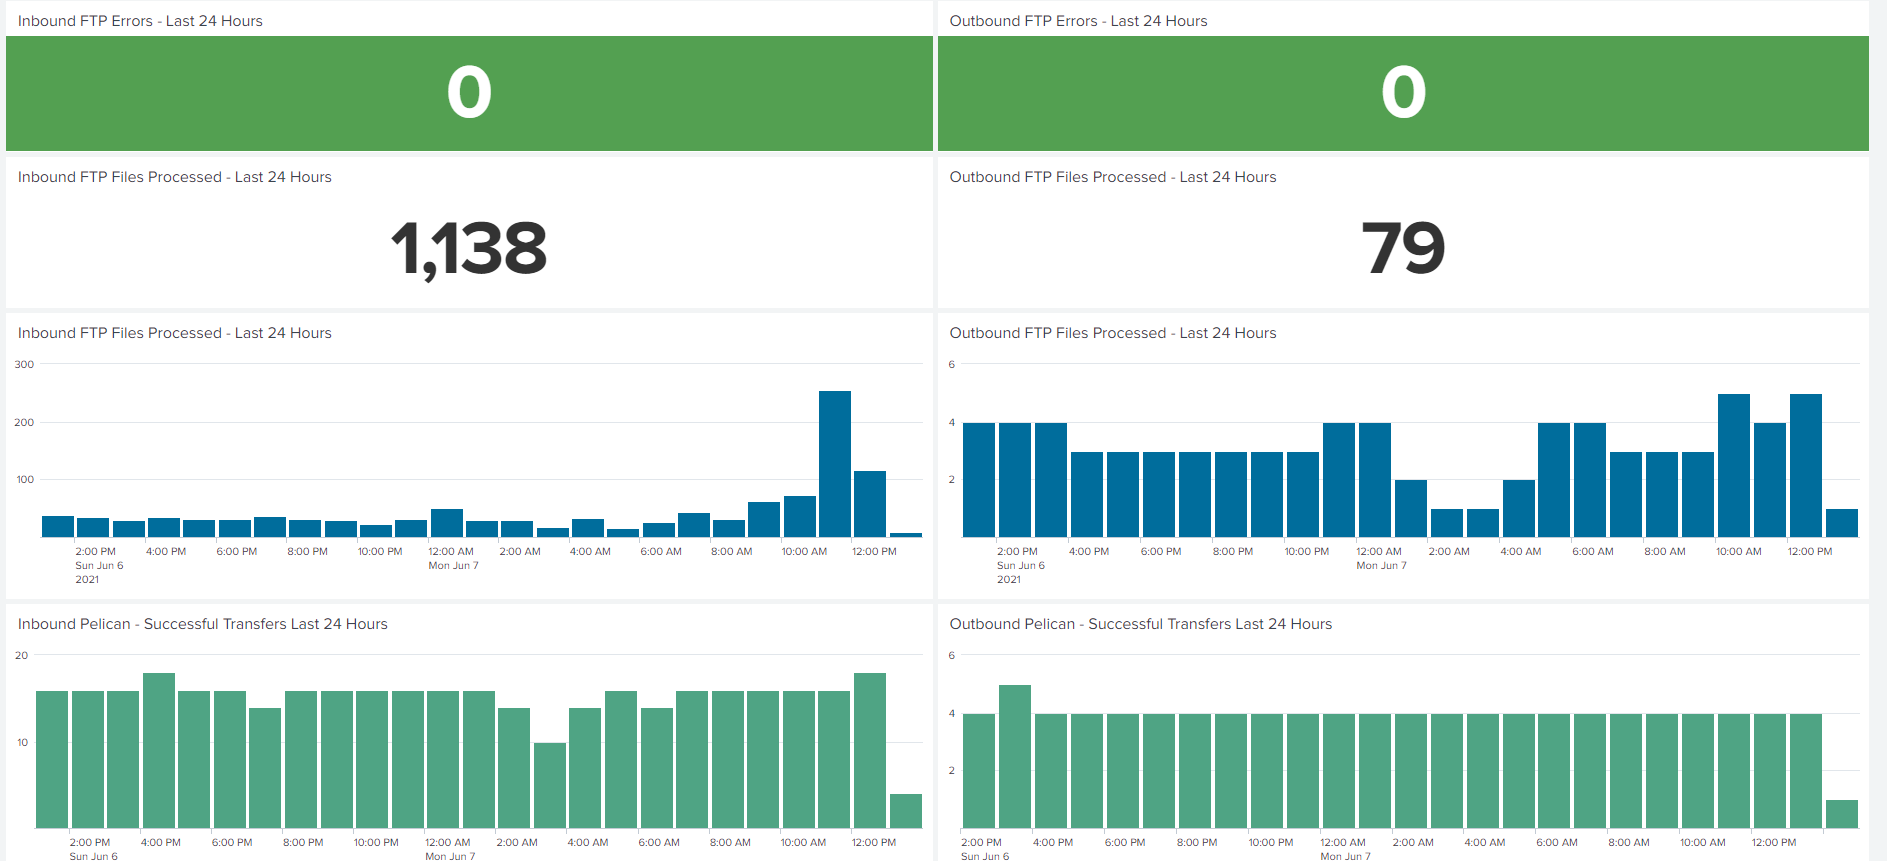
Above is an example of a Splunk dashboard implemented for the data flow previously represented in the "Challenges" section. It provides a numeric count of FTP file transfers over the last 24 hours with companion panels detailing this same information in a time chart. Two panels reflecting the same information for the next leg, Axway file transfers (referred to internally as Pelican), are displayed below it. All panels featured drilldowns into the raw log contents for additional analysis. These panels worked in conjunction with alerts for failures of the FTP jobs, Axway jobs, and Tivoli Workload Scheduler jobs, which directly messaged the responsible support team from Splunk when a failure occurred.
This above data flow also featured an FTP job from an external customer that, upon further analysis, regularly failed during external network outages but was not under the responsibility of any support team. The monitoring team brought this to the attention of the supply chain support manager, performed knowledge transfer, and created an alert to notify the team of this job's failure. We also implemented an alert for "2 hours with no successful transactions" during business hours. In the event of a failure outside of the Michelin network causing no data to appear (but no failures on the Michelin side), the support team would be alerted to investigate and potentially contact our external provider.
Short Term Results
The IT Americas department set a goal for 90% green days on the Control Tower. Below are the month-by-month results of Green Days and Flawless Days, which are days in which no incidents occurred at all:
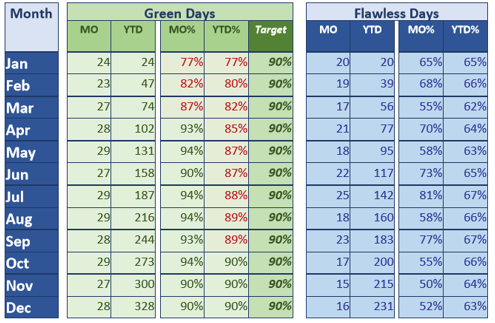
The monitoring initiative started at the beginning of 2018, but flow monitoring was not completed for any of the data flows until late March. From that point in time, there is a distinct increase in percentage of green days. However, the flawless days metric indicates very little variation across the year. This indicates that our green days metric results were not just luck. Issues were still definitely occurring in our business-critical environments, but they were being caught and corrected more quickly and efficiently.
Moving Forward
The results were clear from the control tower - monitoring works, and it needs to continue to grow to maximize its benefits. But how? Monitoring done correctly is never truly completed. The monitoring team has begun focus on multiple key areas:
Community of Practice and Knowledge Transfer
Existing monitoring was proven to be very effective. But what about the other data flows? And what about maintenance of existing monitoring solutions as applications were upgraded and changed? Both are very important but cannot be sustained by a team of only 4 people. From this, the Monitoring Community of Practice was born. This started with a weekly meeting and Teams channel for anyone interested in learning more about monitoring tools and practices with a target of creating a group of power users for monitoring within their domains who assume ownership of their respective solutions. This would move the monitoring team into more of a coaching and evangelizing role.
Best Practices
Monitoring has been set up successfully, but how do we do so more efficiently moving forward? The monitoring team developed a set of best practices and requirements needed for monitoring, providing teams with a template to get started. This information will also be shared with teams developing new applications with the goal of keeping monitoring needs in mind during the development process.
Using new tools and monitoring new technologies
Our toolset successfully monitored 12 legacy data flows. Will that same toolset adequately monitor new data flows and new applications? The monitoring team would need to research new tools and study how to pull in data from APIs for SaaS-based solutions.
Event Management
Alerts are great for notifying support teams of issues, but how are we tracking and reporting these issues? We need to develop a way to interface with our ServiceNow ticket tracking system.
Proactive monitoring, machine learning and AI
What if we had enough data and ability to analyze it that we could stop incidents before they happen?
I will cover these above topics in Our Monitoring Journey in North America - Part 2 later this year.