
Tackling Snowflake Waste
Through fine-grained usage analysis


Snowflake is becoming a widely-used solution for creating data products derived from massive datasets. We all share the same problems with these usage-based cost models that most SaaS providers have embraced. Everything's fine until your teams start using the product massively for very different use cases.
Now, I think we all noticed that the current economic uncertainties have made companies more cautious about how they spend their money.
That's why, when we talk about cleaning things up, let's be honest—the main motivation is to reduce costs.
But there's another benefit that's often overlooked and, in my opinion, just as important: improving the developer experience. Would you rather work at a clean, tidy desk or behind piles of books that block your screen, with a keyboard full of sandwich crumbs? The analogy is spot on.
What This Article Is Not About
Before diving deeper, let's clarify what this article won't cover. We won't be discussing:
- Query optimization techniques (like proper join strategies or filter placement)
- Data modeling for performance
- Warehouse sizing recommendations
These topics are well-covered in other resources and, while important, address a different aspect of Snowflake optimization.
What This Article Is About
I work in a complex organization where multiple personas (data engineers, data scientists, product owners, sales engineers, ...) use Snowflake for a wide range of projects (R&D, PoCs, exposed data products, ...) with complete autonomy.
Anyone who has ever tried to clean up infrastructure has run into two main challenges:
- Identifying resources that are truly unused
- Figuring out who is actually responsible for those resources
No surprise here: without monitoring, you’re flying blind.
Snowflake does provide dashboards to help spot broad consumption trends. Unfortunately, that’s not nearly enough to drive action—you need much more granular metrics.
So, let’s start by tackling bad practices in warehouse usage by our users. After that, we’ll look at how to reduce the impact of storage on your bill.
Part one: Inefficient Warehouse Usage
We want our users to be free to choose the warehouse size on which they want to run their queries. I strongly believe this is very important for a great developer experience. It encourages our users autonomy and shows the trust we have in them. Naturally, this privilege sometimes gets a little overused.
Let’s start by identifying inefficient queries—those that could have been executed on a smaller warehouse. For this demonstration, let’s assume that any query running for less than 30 seconds should have used a smaller warehouse size. While this is a somewhat opinionated threshold, it provides a practical starting point for analysis.
SET start_date = '2025-05-01';
SET end_date = '2025-06-01';
SET duration_threshold = 30000;

WITH small_usage AS (
    SELECT
        user_name,
        COUNT(query_id) AS count_s
    FROM snowflake.account_usage.query_history
    WHERE
        start_time BETWEEN $start_date AND $end_date
        AND total_elapsed_time < $duration_threshold
        AND warehouse_size = 'Small'
    GROUP BY user_name
),
medium_usage AS (
    SELECT
        user_name,
        COUNT(query_id) AS count_m
    FROM snowflake.account_usage.query_history
    WHERE
        start_time BETWEEN $start_date AND $end_date
        AND total_elapsed_time < $duration_threshold
        AND warehouse_size = 'Medium'
    GROUP BY user_name
)
SELECT
    s.user_name,
    s.count_s AS bad_requests_on_small,
    m.count_m AS bad_requests_on_medium
FROM small_usage s
LEFT JOIN medium_usage m
    ON s.user_name = m.user_name
ORDER BY
    m.count_m DESC NULLS LAST,
    s.count_s DESC NULLS LAST;
Listing inefficient queries on small and medium warehouses by user
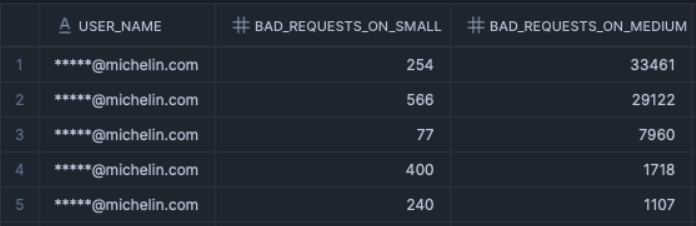
In this example, we see that the first two users are making excessive use of medium warehouses, even though their use cases don’t require it.
This base query can serve as a foundation for building dashboards tailored to your own way of working. For instance, by joining with the users view, you can create detailed breakdowns by user type and role.
Now, how do we change that ?
It may seem obvious but one of the most effective strategies is to make users aware of the situation. This can be done through self-service dashboarding, regular reports, or even alerting on thresholds.
This visibility often naturally leads to more responsible usage as users become aware of the financial impact of their actions. And please don't make the mistake of referring to "Snowflake credits" when talking to people. Use actual money so they can relate and make sense of the resources they are using.
Less than a week after sharing these statistics with our users, the number of inefficient queries dropped by 65%.
A Note About Warehouse Idle Time
Beyond the higher processing cost inherent to larger warehouses, this bad habit tends to increase your bill due to warehouse idle time. Awaking a warehouse means you’ll be billed for at least one minute of compute, even if your query only lasted a few milliseconds. The key is to find the right balance to minimize this overhead, which doesn’t actually deliver any value.
The following query lets you monitor the credit cost of your warehouse idle time.
SELECT
    warehouse_name,
    (
    SUM(credits_used_compute) -
    SUM(credits_attributed_compute_queries)
    ) AS idle_cost,
FROM snowflake.account_usage.warehouse_metering_history
WHERE
    start_time >= DATEADD('days', -30, CURRENT_DATE())
    AND end_time < CURRENT_DATE()
GROUP BY warehouse_name;
Idle cost per warehouse for the last 30 days
If the results seem wildly out of proportion, it’s a clear sign that it’s time to take a closer look at your usage.
Part two: Unused Storage
Now let's focus on storage. While compute costs often dominate Snowflake bills, storage costs tend to silently accumulate over time. Every time someone forgets a temporary data duplication somewhere, you end up paying for it each month. Years later, you might regret not having looked at it sooner.
Now, to be able to act on unused storage, you want to know, for each table, when it was last used and who are the people accountable for it.
WITH schema_last_usage AS (
SELECT
database_name,
schema_name,
MAX(start_time) AS last_usage_date,
LISTAGG(DISTINCT user_name, ',') AS user_list
FROM snowflake.account_usage.query_history
GROUP BY database_name, schema_name
)
SELECT
sm.table_catalog,
sm.table_schema,
sm.table_name,
(ACTIVE_BYTES + TIME_TRAVEL_BYTES + FAILSAFE_BYTES + RETAINED_FOR_CLONE_BYTES) / 1000000000 AS size_gb,
GREATEST_IGNORE_NULLS(
-- tries to search directly inside the queries text for table fully qualified name
(
SELECT MAX(start_time)
FROM snowflake.account_usage.query_history
WHERE CONTAINS(query_text, CONCAT(sm.table_catalog, '.', sm.table_schema, '.', sm.table_name))
),
slu.last_usage_date, -- fallback to schema level
) AS last_usage,
slu.user_list AS schema_users
FROM snowflake.account_usage.table_storage_metrics sm
JOIN schema_last_usage slu
ON slu.database_name = sm.table_catalog
AND slu.schema_name = sm.table_schema
WHERE sm.deleted = FALSE
AND sm.table_dropped IS NULL
AND size_gb > 10 -- filter out very small tables
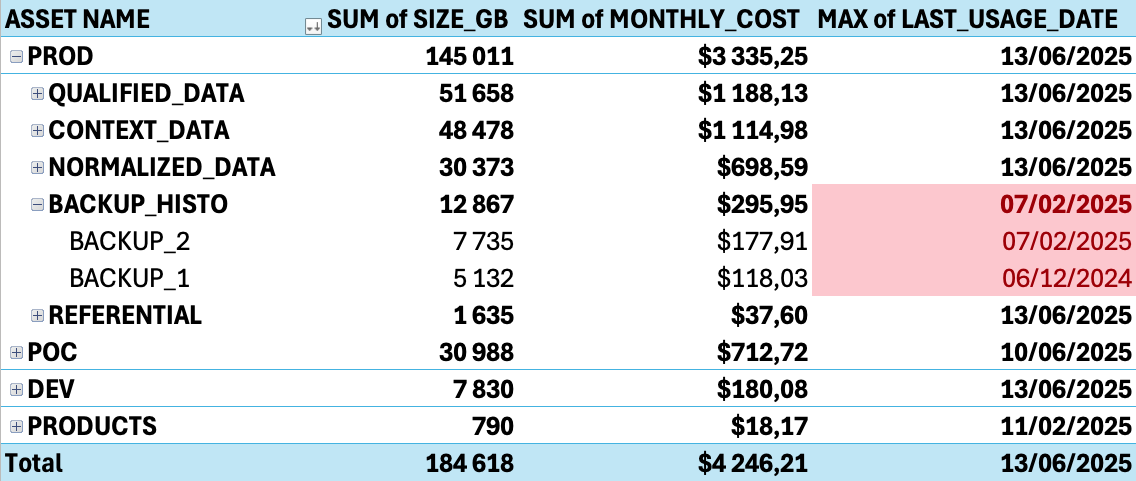
ORDER BY size_gb DESC;This query can take a few minutes to execute on large history but it helps identify:
- Large tables that are never queried
- Duplicate or redundant datasets
- Test or development data that was never cleaned up
Unfortunately, Snowflake dashboards do not permit creating pivot tables but you can easily extract those data to any visualization tool of your linking (Grafana, PowerBI, ...).
You now have everything you need to notify data owners and empower them to take action based on actual metrics.The next step is to automate the process and make cleanup continuous.
Regularly purging unused databases, schemas, and tables also improves the readability of your object hierarchy. This, in turn, enhances dataset discoverability and makes onboarding new team members much simpler.
A Note About Cloning Side Effects
Zero-copy cloning is a very convenient feature and we rely a lot on it. However, it can lead to unexpected storage costs if not managed carefully.When you clone a table, the data is shared between the original and clone until either is modified. What it means is that if you purge the original table, then the clone will retain every byte as long as it lives and you will not have the expected storage cost reduction.
The BYTES_RETAINED_FOR_CLONE metric shows how much storage is being retained due to cloning.For this reason, I recommend enforcing a limited lifetime for clones.
Final thoughts
Even though this article offers solutions specific to Snowflake, the ideas and techniques presented here are easily transferable to other contexts.
Remember that the goal isn't to restrict legitimate usage but to eliminate waste. When implemented correctly, these practices not only reduce costs but improve the overall developer experience. By removing unused assets, you help simplify the work environment, making the datasets easier to discover. In doing so, you reduce cognitive load and make onboarding new team members much easier.
Be aware that cost optimization is not a one-time exercise but an ongoing discipline. Implement continuous monitoring solutions to detect when usage drifts from optimal patterns.
Finally, the most sustainable approach to waste reduction is cultural. When your team understands the impact of their usage decisions, they naturally make better choices.